IMAGE

Fig. 2.

ID
ZDB-IMAGE-210518-93
Genes
Source
Figures for Oprişoreanu et al., 2021
Image
Figure Caption

Fig. 2.

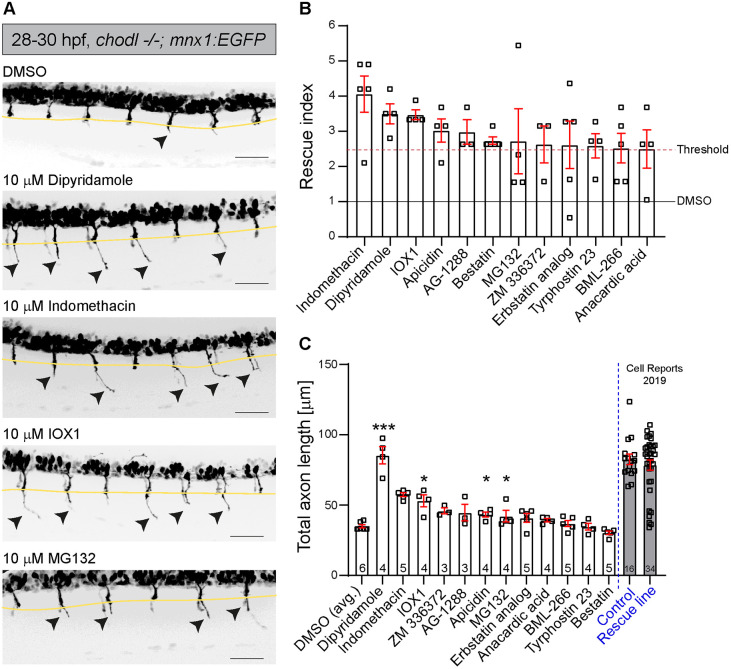
Several compounds significantly increase the number of axons that grow beyond the HM. (A) Representative VAST images of 28-29 hpf drug-treated chodl mutant embryos. Arrowheads indicate CaP motor axons beyond the HM (yellow line). Scale bars: 50 µm. (B) The 12 compound hits with the highest rescue index, presented according to the percentage of motor axons that crossed the HM in comparison to that of internal control (DMSO-chodl mutant). Compounds were tested at 10 µM. Each data point represents one animal. Error bars represent means±s.e.m. (C) The 12 compound hits are ranked according to the total length of CaP motor axons after compound application. The average length of CaP motor axons in DMSO-chodl mutant is 35.06 µm. Statistical tests were performed, comparing the drug treatment with its own DMSO-chodl mutant control (dipyridamole, Kruskal–Wallis test with Dunn's multiple comparison test ***P=0.0009, statistical power=0.999; IOX1, Mann–Whitney test *P=0.0159, statistical power=0.9750; MG132, Mann–Whitney test *P=0.0242, statistical power=0.9620; apicidin, Kruskal–Wallis test with Dunn's multiple comparison test *P=0.0306, statistical power=0.9564). Grey bars represent previously published data (Opris¸oreanu et al., 2019), and are used to estimate the effect of various compounds on the length of CaP motor axons compared to that in wild-type embryos (Control) and chodl mutant embryos, in which the phenotype was rescued by stable overexpression of chodl in motor neurons (Rescue line). Each data point represents one animal, n-numbers are indicated in each bar. Error bars represent means±s.e.m.

Figure Data
Acknowledgments
This image is the copyrighted work of the attributed author or publisher, and ZFIN has permission only to display this image to its users. Additional permissions should be obtained from the applicable author or publisher of the image. Full text @ Dis. Model. Mech.