FIGURE SUMMARY
Title

Involvement of cerebellar neural circuits in active avoidance conditioning in zebrafish

Authors
Koyama, W., Hosomi, R., Matsuda, K., Kawakami, K., Hibi, M., Shimizu, T.
Source
Full text @ eNeuro

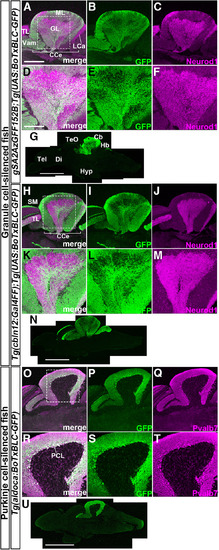
Establishment of Tg fish that express botulinum toxin in GCs or PCs. Sagittal sections of adult gSA2AzGFF152B;Tg(UAS:BoTxBLC-GFP) (A–G), Tg(cbln12:Gal4FF);Tg(UAS:BoTxBLC-GFP) (H–N), and Tg(aldoca:BoTxBLC-GFP) (O–U) brains were stained with anti-GFP (green), and anti-Neurod1, or anti-parvalbumin 7 (Pvalb7, magenta) antibodies. A–C, H–J, O–Q, Cerebellum region. D–F, K–M, R–T, High-magnification views of the boxes in A, H, O. G, N, U, Low-magnification views. Cb, cerebellum; CCe, corpus cerebelli; Di, diencephalon; GL, granular layer; Hb, hindbrain; Hyp, hypothalamus; LCa, lobus caudalis cerebelli; ML, molecular layer; PCL; PC layer; SM, stratum marginale; Tel, telencephalon; TeO, tectum opticum; TL, torus longitudinalis; Vam, medial division of valvula cerebelli. Scale bars: 400 μm (A; applies to A–C, H–J, O–Q), 200 μm (D; applies to D–F, K–M, R–T), 1 mm (G, N, U).

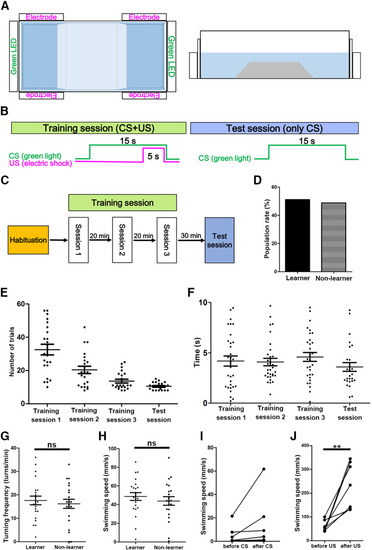
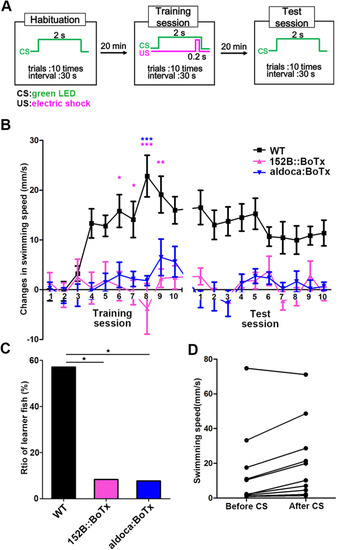
Active avoidance conditioning of wild-type fish. A, Tank used for active avoidance conditioning. A white opaque tank (L41 cm × W17 cm × H12 cm) with transparent walls at both ends, and a trapezoidal wedge (L10–20 cm × W17 cm × H5 cm) in the center, were used. Green LEDs and a pair of electrodes were placed on each side. Top view (left panel) and side view (right panel). B, C, Protocol for active avoidance. In the habituation session, a fish was allowed to swim freely for 20 min in the tank. In the training session, when a fish was located in a side compartment, the LED was turned on for 15 s (CS). If the fish did not escape to the other side after 10 s, an electric shock was administered for 5 s (US) in each trial. When the fish moved before the electric shocks, the trial was successful and was followed by a 30-s interval and the next trial. When fish had eight successful trials among 10 consecutive trials, they were considered to have established active avoidance in the training session, and were subjected to the next trial session. When fish did not establish active avoidance within 60 trials, the training session was terminated. When fish established active avoidance in three consecutive training sessions, they were subjected to the test session. In the test session, only light stimuli with LEDs were administered. When the fish had eight successful trials among 10 consecutive trials in the training session, they were considered to be learners. When fish did not establish active avoidance in the training session or did not succeed in the test session, they were considered to be non-learners. D, Acquisition of active avoidance conditioning in wild-type adult fish. Percentages of learners and non-learners are indicated (n =43). E, Number of trials when learner fish established active avoidance in the training and test sessions (n =22). The graph shows averages and SEs of the data. F, Time from CS to escape in each session of learner fish (n =7). The graph shows averages and SEs of the data. G, H, Swimming behaviors. Turning frequency (turns/min) and swimming speed (mm/s) of learners and non-learners during free swimming (learner; n =22, non-learner; n =21). The graph shows averages and SEs of the data (ns indicates non-significance, Welch’s t test). I, Freezing response of non-learners. Average swimming speed (mm/s) of seven non-learners before and after the onset of CS in the 44th–53rd trials of training session 1 was calculated. J, Test for responsiveness to electric shocks in wild-type adult fish (n =7). Swimming speed for 2 s before and after electric shocks was calculated (**p <0.01, Welch’s t test). ns, not significant.

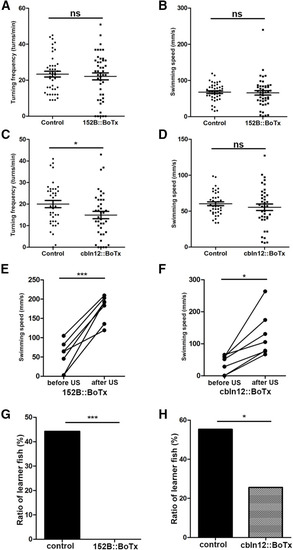
Expression of botulinum toxin in GCs suppresses active avoidance conditioning. A, B, Turning frequency (turns/min) and swimming speed (mm/s) of gSA2AzGFF152B;Tg(UAS:BoTxBLC-GFP) (152B::BoTx) and control sibling fish during free swimming (152B::BoTx; n =47, control; n =43). The graph shows the averages and SEs of the data (ns indicates non-significance, Welch’s t test. C, D, Turning frequency and swimming speed of Tg(cbln12:Gal4FF);Tg(UAS:BoTxBLC-GFP) (cbln12::BoTx) fish during free swimming (cbln12::BoTx; n =39, control; n =38). The graph shows the averages and SEs of the data (ns indicates non-significance, *p <0.05, Welch’s t test). E, F, Response to electric shocks in 152B::BoTx (n =7) and cbln12::BoTx (n =7) fish. Swimming speed was calculated for 2 s before and after the electric shocks (***p <0.001, *p <0.05, Welch’s t test). G, H, Percentages of active avoidance learners for 152B::BoTx (n =47) and control sibling fish (n =43; G), and for cbln12::BoTx (n =39), and control sibling fish (n =38; H; ***p <0.001, *p <0.05, Fisher’s exact test). ns, not significant.

Expression of botulinum toxin in PCs suppresses active avoidance conditioning. A, B, Turning frequency (turns/min) and swimming speed (mm/s) of Tg(aldoca:BoTxBCL-GFP) (aldoca:BoTx) and control sibling fish during free swimming (aldoca:BoTx; n =45, control; n =35). The graph shows the averages and SEs of the data (ns indicates non-significance, Welch’s t test). C, Response to electric shocks in aldoca:BoTx fish (n =7). Swimming speed was calculated for 2 s before and after the electric shocks (***p <0.001, Welch’s t test). D, Percentages of active avoidance learners of aldoca:BoTx (n =45) and control (n =35) fish (**p <0.01, Fisher’s exact test). E, Number of trials required to establish active avoidance conditioning (aldoca:BoTx: n =6; control: n =16). The graph shows the averages and SEs of the data (ns indicates non-significance, Welch’s t test).

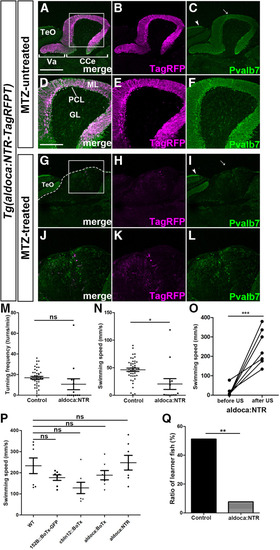
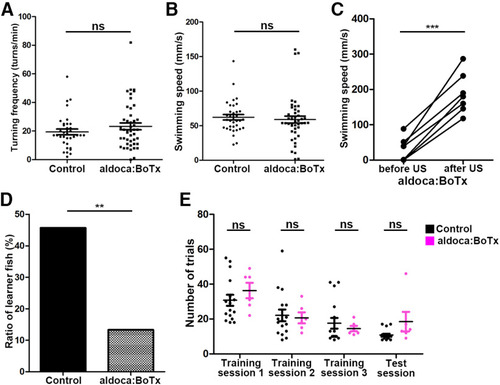
NTR-mediated ablation of PCs in adult fish suppresses active avoidance conditioning. A–L, Ablation of PCs. Adult Tg(aldoca:NTR-TagRFPT) fish were treated with MTZ for 18 h (A–F) or left untreated (G–L). The fish were subjected to behavior assays and subsequent histologic analysis 11 d after MTZ treatment. Sagittal sections were stained with anti-Pvalb7 antibody (green). Expression of NTR-TagRFPT (TagRFP, magenta) is also shown. D–F, J–L, High-magnification views of the boxes in A, G. Arrows and arrow heads indicate Pvalb7-positive dendrites of PCs (in the cerebellum) and Type I neurons (in the optic tectum), respectively. The dotted line in G indicates the limit of the cerebellum. Note that the Pvalb7 signal in PCs but not in Type I neurons disappeared and no ML was observed in the MTZ-treated fish. M, N, Turning frequency (turns/min) and swimming speed (mm/s) of Tg(aldoca:NTR-TagRFPT) (aldoca:NTR) and control fish during free swimming (aldoca:NTR; n =13, control; n =43). The graph shows the averages and SEs of the data (ns indicates non-significance, *p <0.05, Welch’s t test). O, Response to electric shocks in adult aldoca:NTR fish treated with MTZ (n =7). Swimming speed was calculated for 2 s before and after the electric shocks (***p <0.001, Welch’s t test). P, Swimming speed for 2 s after US in each strain. The graph shows the averages and SEs of the data (ns indicates non-significance, one-way repeated measures ANOVA with Tukey’s post hoc test). Q, Percentage of active avoidance learners of aldoca:NTR (n =13) and control wild-type (n =43) fish (**p <0.01, Fisher’s exact test). Va, valvula cerebelli. The other abbreviations are described in Figure 1. Scale bars: 400 μm (A; applies to A–C, G–I) and 200 μm (D; applies to D–F, J–L). ns, not significant.

Expression of botulinum toxin in GCs or PCs also perturbs classical conditioning responses. A, Protocol for classical fear conditioning. A compartment on one side of the tank in Figure 2A was used. In the habituation session, a light stimulus (CS) was provided for 2 s per trial (10 trials). In the training session, a paired CS and US (0.2-s electric shock given 1.8 s after the onset of CS) was administered in each trial (10 trials). In the test session, CS alone was administered (10 trials). The interval between trials was 30 s, and the interval between sessions was 20 min. B, Changes in swimming speed before and after the CS of wild-type (WT, n =25), 152B::BoTx (n =23), and aldoca:BoTx (n =24) fish. Swimming speed was measured for 1.5 s before and after the CS in each trial, and average changes in swimming speed in the training and test sessions were calculated. The graph shows the averages and SEs of the data (Training session; lines factor: p =1.483e-07, trials factor: p =1.189e-07, lines × trials interaction: p =1.398e-06, two-way repeated measures ANOVA; ***p <0.001, **p< 0.01, *p <0.05, two-way repeated measures ANOVA with Tukey’s post hoc test. Test session; lines factor: p =1.398e-06, trials factor: p =0.171, lines × trials interaction: p =0.3649, two-way repeated measures ANOVA; WT vs 152B::BoTx in test session: p <1e-22, WT vs aldoca:BoTx in test session: p <1e-22, 152B::BoTx vs aldoca:BoTx in test session: p =0.9425, one-way ANOVA with Tukey’s post hoc test). C, Percentages of Pavlovian conditioning learners of WT (n =14), 152B::BoTx (n =12), and aldoca:BoTx (n =13) fish (*p <0.05, Fisher’s exact test with BH post hoc test). D, Pavlovian panic responses during active avoidance conditioning. Data from 10 wild-type fish that were subjected to active avoidance conditioning were used. Since wild-type fish established active avoidance in the 13th trial at the earliest, swimming speed for 1.5 s before and after the CS was measured in each trial from the fourth to the 13th trial. Average speed is plotted in the graph.

Acknowledgments
This image is the copyrighted work of the attributed author or publisher, and ZFIN has permission only to display this image to its users. Additional permissions should be obtained from the applicable author or publisher of the image. Full text @ eNeuro