IMAGE

Figure 2.

ID
ZDB-IMAGE-210611-82
Source
Figures for Koyama et al., 2021
Image
Figure Caption

Figure 2.

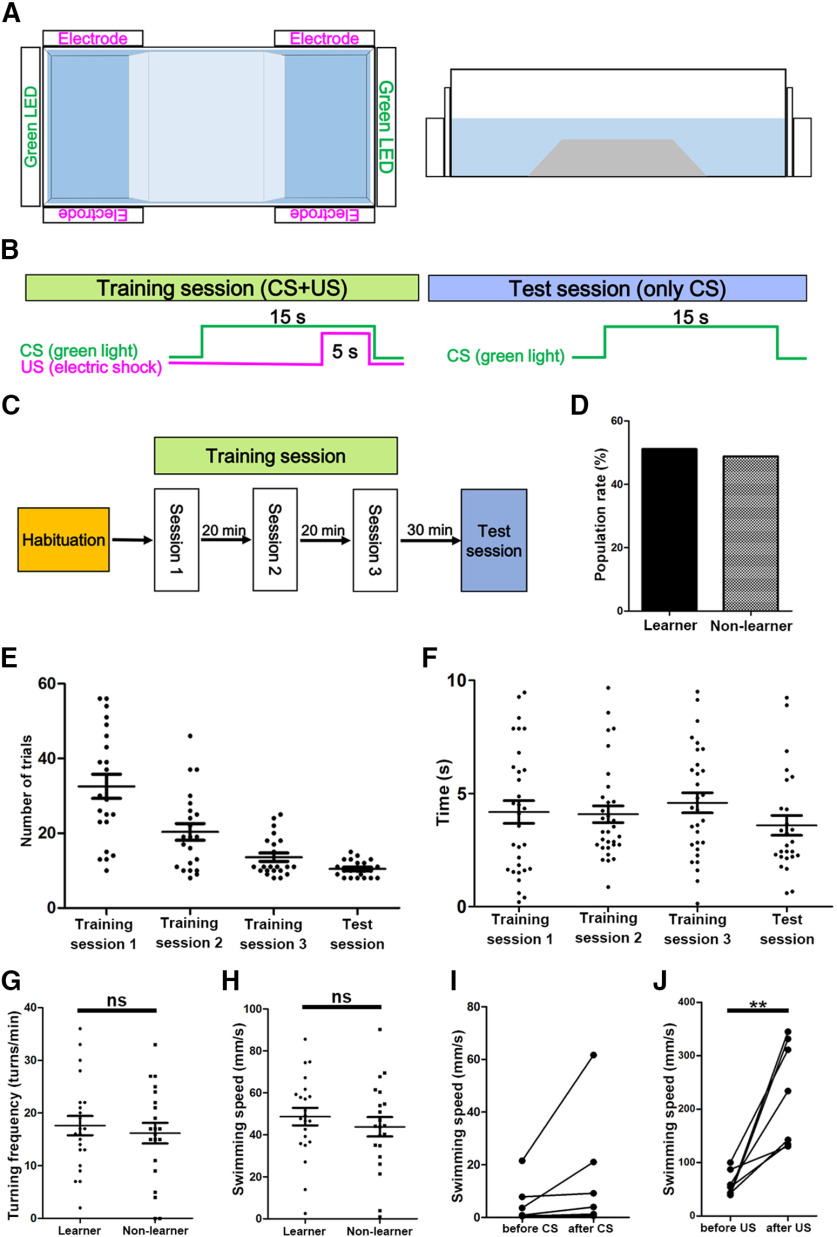
Active avoidance conditioning of wild-type fish. A, Tank used for active avoidance conditioning. A white opaque tank (L41 cm × W17 cm × H12 cm) with transparent walls at both ends, and a trapezoidal wedge (L10–20 cm × W17 cm × H5 cm) in the center, were used. Green LEDs and a pair of electrodes were placed on each side. Top view (left panel) and side view (right panel). B, C, Protocol for active avoidance. In the habituation session, a fish was allowed to swim freely for 20 min in the tank. In the training session, when a fish was located in a side compartment, the LED was turned on for 15 s (CS). If the fish did not escape to the other side after 10 s, an electric shock was administered for 5 s (US) in each trial. When the fish moved before the electric shocks, the trial was successful and was followed by a 30-s interval and the next trial. When fish had eight successful trials among 10 consecutive trials, they were considered to have established active avoidance in the training session, and were subjected to the next trial session. When fish did not establish active avoidance within 60 trials, the training session was terminated. When fish established active avoidance in three consecutive training sessions, they were subjected to the test session. In the test session, only light stimuli with LEDs were administered. When the fish had eight successful trials among 10 consecutive trials in the training session, they were considered to be learners. When fish did not establish active avoidance in the training session or did not succeed in the test session, they were considered to be non-learners. D, Acquisition of active avoidance conditioning in wild-type adult fish. Percentages of learners and non-learners are indicated (n =43). E, Number of trials when learner fish established active avoidance in the training and test sessions (n =22). The graph shows averages and SEs of the data. F, Time from CS to escape in each session of learner fish (n =7). The graph shows averages and SEs of the data. G, H, Swimming behaviors. Turning frequency (turns/min) and swimming speed (mm/s) of learners and non-learners during free swimming (learner; n =22, non-learner; n =21). The graph shows averages and SEs of the data (ns indicates non-significance, Welch’s t test). I, Freezing response of non-learners. Average swimming speed (mm/s) of seven non-learners before and after the onset of CS in the 44th–53rd trials of training session 1 was calculated. J, Test for responsiveness to electric shocks in wild-type adult fish (n =7). Swimming speed for 2 s before and after electric shocks was calculated (**p <0.01, Welch’s t test). ns, not significant.

Acknowledgments
This image is the copyrighted work of the attributed author or publisher, and ZFIN has permission only to display this image to its users. Additional permissions should be obtained from the applicable author or publisher of the image. Full text @ eNeuro