FIGURE

Figure 3.

ID
ZDB-FIG-210611-83
Publication
Koyama et al., 2021 - Involvement of cerebellar neural circuits in active avoidance conditioning in zebrafish
Other Figures
All Figure Page
Back to All Figure Page
Figure 3.

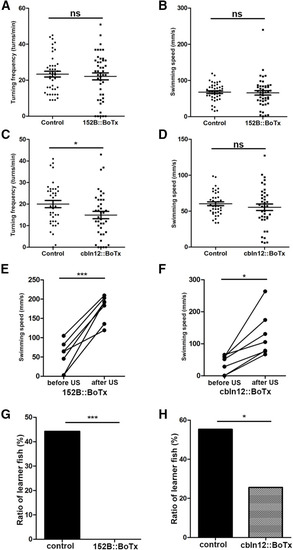
Expression of botulinum toxin in GCs suppresses active avoidance conditioning. A, B, Turning frequency (turns/min) and swimming speed (mm/s) of gSA2AzGFF152B;Tg(UAS:BoTxBLC-GFP) (152B::BoTx) and control sibling fish during free swimming (152B::BoTx; n =47, control; n =43). The graph shows the averages and SEs of the data (ns indicates non-significance, Welch’s t test. C, D, Turning frequency and swimming speed of Tg(cbln12:Gal4FF);Tg(UAS:BoTxBLC-GFP) (cbln12::BoTx) fish during free swimming (cbln12::BoTx; n =39, control; n =38). The graph shows the averages and SEs of the data (ns indicates non-significance, *p <0.05, Welch’s t test). E, F, Response to electric shocks in 152B::BoTx (n =7) and cbln12::BoTx (n =7) fish. Swimming speed was calculated for 2 s before and after the electric shocks (***p <0.001, *p <0.05, Welch’s t test). G, H, Percentages of active avoidance learners for 152B::BoTx (n =47) and control sibling fish (n =43; G), and for cbln12::BoTx (n =39), and control sibling fish (n =38; H; ***p <0.001, *p <0.05, Fisher’s exact test). ns, not significant.

Expression Data

Expression Detail
Antibody Labeling
Phenotype Data

Phenotype Detail
Acknowledgments
This image is the copyrighted work of the attributed author or publisher, and ZFIN has permission only to display this image to its users. Additional permissions should be obtained from the applicable author or publisher of the image. Full text @ eNeuro