
- Title
-
Gnrh2 maintains reproduction in fasting zebrafish through dynamic neuronal projection changes and regulation of gonadotropin synthesis, oogenesis, and reproductive behaviors
- Authors
- Marvel, M., Levavi-Sivan, B., Wong, T.T., Zmora, N., Zohar, Y.
- Source
- Full text @ Sci. Rep.
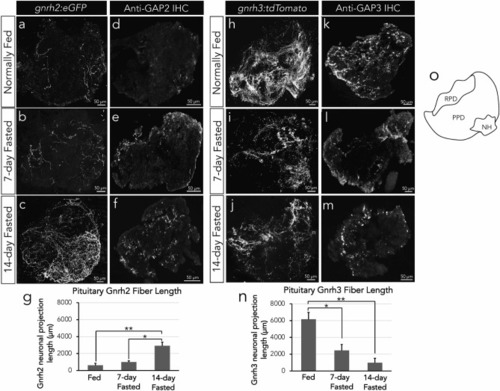
Confocal imagery of |
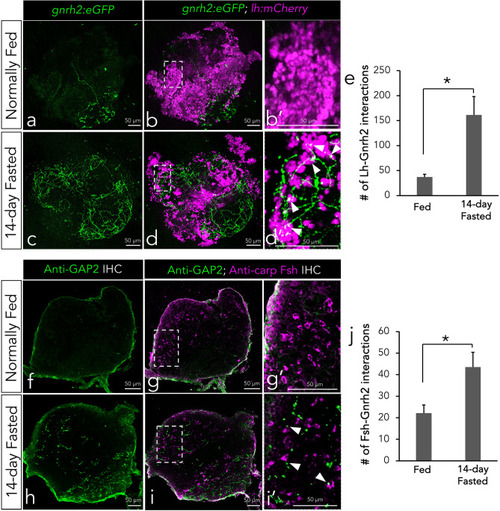
Confocal imagery of whole |
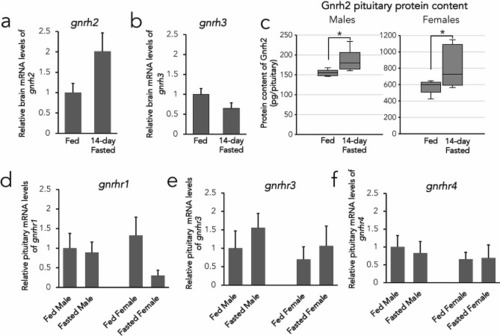
Expression profiles of the Gnrh system in fed and fasted conditions of wild-type zebrafish. Relative mRNA levels of |
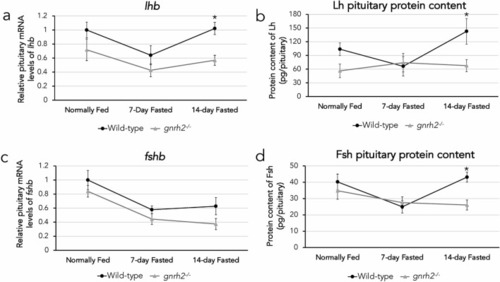
Expression differences of Lh and Fsh in wild-type and |
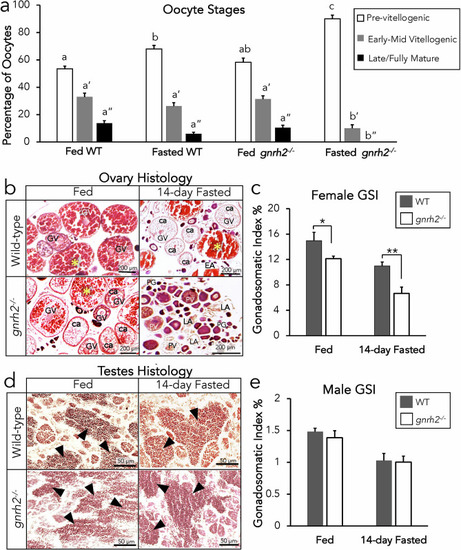
Gametogenesis analysis of knockout and WT zebrafish undergoing fed and fasted conditions. Percentage of oocytes at pre-vitellogenic, early-mid vitellogenic, and late/fully mature stages of WT and |
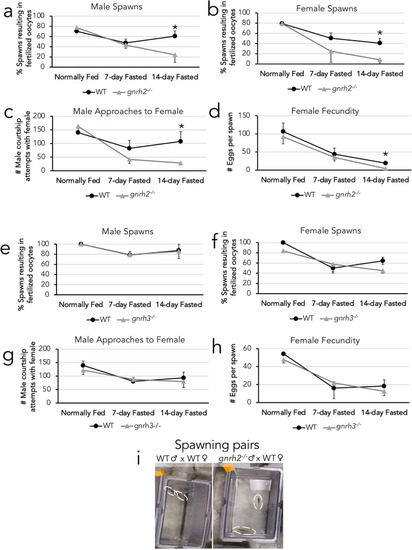
Reproductive outputs of male (n = 8–10 per group) and female (n = 5–8 per group) WT, gnrh2, and gnrh3 fish undergoing 0, 7, and 14-day fasting, including WT and gnrh2−/− comparisons of male spawning percentages (a), female spawning percentages (b), quantification of male courtship attempts with female partners (c), and female fecundities (d). WT and gnrh3−/− comparisons of male spawning percentages (e), female spawning percentages (f), quantification of male courtship attempts with female partners (g), and female fecundities (h). Still image from video of spawning tanks demonstrating typical behavior of WT males chasing females and gnrh2−/− males less frequently chasing female partners (i) All data expressed as means ± S.E.M, *P < 0.05. |