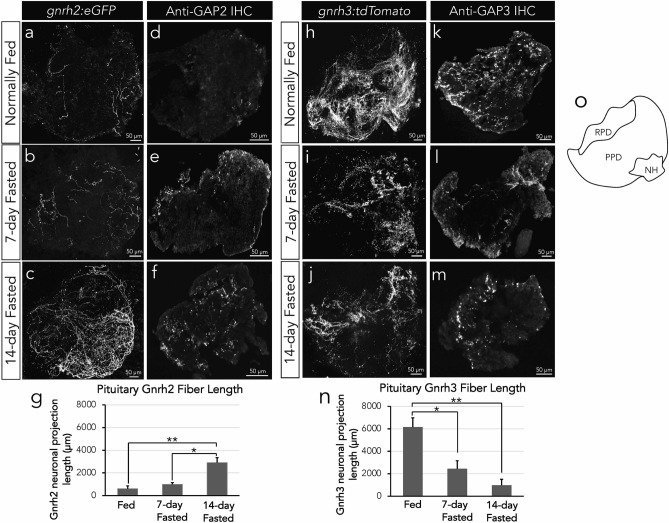
IMAGE

Figure 1

ID
ZDB-IMAGE-210327-52
Source
Figures for Marvel et al., 2021
Image
Figure Caption

Figure 1

Confocal imagery of tg(gnrh2:eGFP) pituitaries in normally fed (a), 7-day fasted (b) and 14-day fasted (c) conditions. Antibody staining of the specific GAP2 region of Gnrh2 in pituitary cryosections of fed (d), 7-day fasted (e), and 14-day fasted zebrafish (d) with the quantification of Gnrh2 neuronal fiber lengths confirming increased Gnrh2 in 14-day fasted conditions (e). Confocal imagery of tg(gnrh3:tdTomato) pituitaries in normally fed (f) and 14-day fasted (h) conditions. Immunohistochemistry antibody staining of the specific GAP3 region of Gnrh3 in pituitary cryosections of fed (g) and 14-day fasted zebrafish (i) with the quantification of Gnrh3 neuronal fiber lengths confirming decreased Gnrh3 in 14-day fasted conditions (j). Pictoral representation of the pituitary orientation of images shown (k). NH, neurohypophysis; PPD, proximal pars distalis; RPD; rostral pars distalis. All data expressed as means ± S.E.M, n = 6 pituitaries per group, **P < 0.01, *P < 0.05.

Acknowledgments
This image is the copyrighted work of the attributed author or publisher, and ZFIN has permission only to display this image to its users. Additional permissions should be obtained from the applicable author or publisher of the image. Full text @ Sci. Rep.