
Image
|
Figure Caption
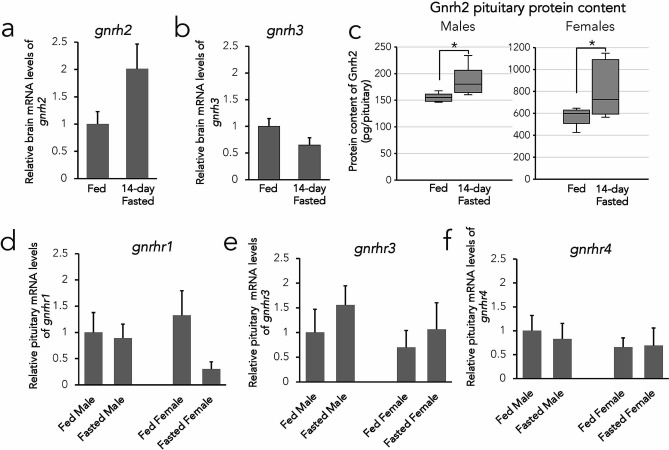
Figure 3
Expression profiles of the Gnrh system in fed and fasted conditions of wild-type zebrafish. Relative mRNA levels of
Acknowledgments
This image is the copyrighted work of the attributed author or publisher, and
ZFIN has permission only to display this image to its users.
Additional permissions should be obtained from the applicable author or publisher of the image.
Full text @ Sci. Rep.