
- Title
-
Distributed chromatic processing at the interface between retina and brain in the larval zebrafish
- Authors
- Guggiana Nilo, D.A., Riegler, C., Hübener, M., Engert, F.
- Source
- Full text @ Curr. Biol.
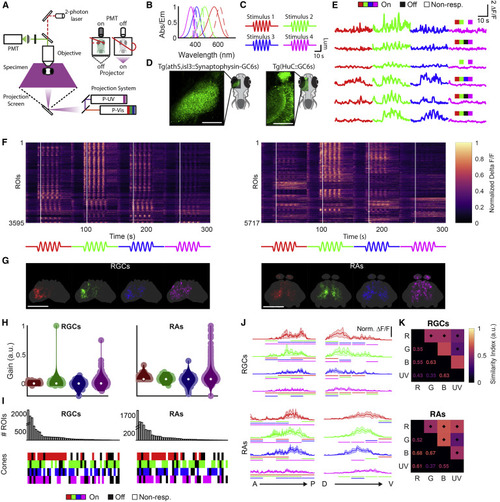
(A) Schematic of the setup used for stimulation, projecting chromatic stimuli from the bottom using a custom-designed projector with four channels. The inset illustrates alternation between stimulation and recording over the mirror turning cycle. (B) Absorption spectra of the zebrafish cones (solid lines) and emission spectra of the LEDs (dotted lines) used in the projector. (C) Full-field, temporally sinusoidal stimuli. (D) Average images from the isl3/ath5:GCaMP6s and HuC:GCaMP6s lines used to label RGCs and RAs, respectively. Scale bars, 100 μm. (E) Representative delta F/F responses to all four stimuli from RGCs and RAs. Indicated in each trace is the spectral type from (I). (F) Full datasets for RGCs and RAs, with intensity reflecting the row-normalized delta F/F, sorted according to clusters depicted in Figure 2. White lines indicate first stimulus peak. (G) Registered and interpolated anatomical maps of the regions of interest (ROIs), colored by preferred stimulus (see STAR Methods). Scale bars, 100 μm. (H) Calculated gains for each cone from each ROI in RGCs and RAs. (I) Spectral types obtained from categorizing the cone gains from both RGCs and RAs (bottom) and their counts (top). (J) Antero-posterior (left) and dorso-ventral (right) normalized calcium response profiles for RGCs (top) and RAs (bottom) for each stimulus. Lines denote p < 0.05 for difference between the region of the profile covered by the line and the corresponding region in the profile indicated by the line’s color, Wilcoxon signed rank. (K) Spatial similarity of the response patterns elicited by the four stimuli. A star denotes overlap significantly different from monochromatic inter-trial overlap, Wilcoxon signed rank, p < 0.05. n = 6 animals and 3,595 ROIs for the RGC data; n = 6 animals and 5,717 ROIs for the RA data. |
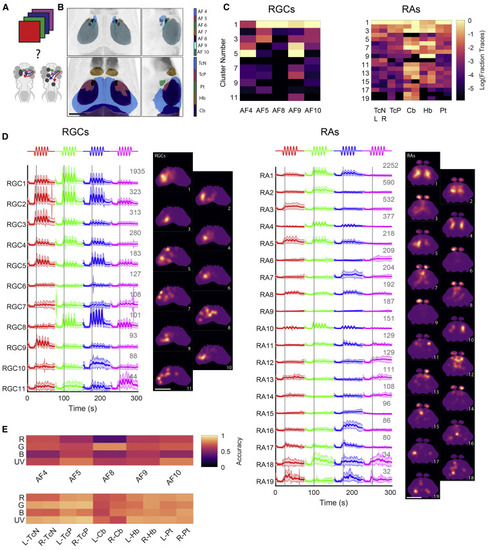
(A) We presented four chromatic stimuli and measured responses from a number of brain regions to identify wavelength-sensitive areas. (B) Anatomical location of the brain regions imaged for the RGC and RA populations. Scale bar, 100 μm. (C) Relative proportion of each cluster found in each of the brain regions imaged (normalized per brain region, plotted as log base 10). (D) Average responses for each cluster, for RGCs (left) and RAs (right). Gray numbers indicate ROI numbers. Maps next to each cluster depict the average location of its ROIs. Gray lines indicate first stimulus peak. Scale bars, 100 μm. (E) Classification accuracy of an SVM classifier trained to discriminate between the stimuli for each region. Top: RGCs; bottom: RAs. AF, arborization field; R- and L-: right and left hemisphere; TcN, tectal neuropil region; TcP, tectal periventricular region; Cb, cerebellum; Hb, habenula; Pt, pretectum. |
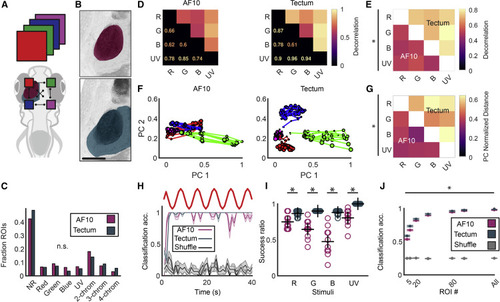
(A) Comparison of the chromatic computations occurring between AF10 and tectum. (B) Anatomical layout of AF10 (top) and ipsilateral tectum (bottom). Scale bar, 100 μm. (C) Histogram quantifying the number of ROIs assigned to the top 75th percentile of each stimulus, no stimulus (NR, non-responsive), or multiple stimuli for both populations. p > 0.05 for all bins tested separately, Wilcoxon signed rank. (D) Overall decorrelation of the neural activity evoked by each stimulus for both datasets. (E) Cluster average decorrelation for all pairs of stimuli for AF10 (below diagonal) and tectum (above diagonal). The deltas were evaluated pairwise; p < 0.05, Wilcoxon rank sum for all squares. (F) CCA-aligned and averaged PC trajectories over the course of the stimulation period for AF10 and tectum. Line color indicates stimulus, with dot size increasing over time. (G) Average pairwise Euclidean distances between the centroids of the point clouds corresponding to each stimulus response in PC space for AF10 and tectum after alignment. ∗p < 0.05, Wilcoxon rank sum performed pairwise. (H) Example SVM-based classification performance over time for AF10 and tectum compared to shuffle. Stimulus is on top. (I) Success ratio for classification of each stimulus in AF10 compared to tectum. ∗p < 0.05, Wilcoxon rank sum. (J) Classification performance for different ROI numbers, with an average of 10 repetitions for both populations and shuffles. * p < 0.05 Wilcoxon rank sum performed pairwise. (A–E, H, and I) n = 6 animals and 1,776 ROIs for tectum; n = 6 animals and 2,670 ROIs for AF10. (F and G) n = 3 animals and 1,604 ROIs for tectum; n = 5 animals and 1,313 ROIs for AF10. |
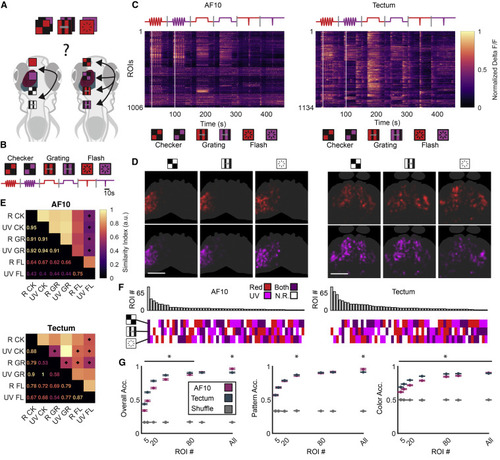
(A) Red or UV stimuli were utilized to assess whether different spatiotemporal patterns affect wavelength processing between AF10 and tectum. (B) Schematic of the stimuli, combining spatiotemporal patterns with red and UV. (C) Trial-averaged fluorescence traces. Intensity is row-normalized fluorescence. Traces were sorted via hierarchical clustering for display. White lines show the first peak of the checkerboard oscillation. (D) Anatomical interpolated ROI distribution from AF10 (left) and tectum (right), depicted according to the stimulus that elicited the maximum response for that ROI. Scale bars, 100 μm. (E) Anatomical similarity matrix for the response patterns elicited by each stimulus. A star denotes overlap significantly different from inter-trial overlap, Wilcoxon signed rank, p < 0.05. (F) Breakdown of the spectral/pattern types for both populations. Top: count of ROIs of each type. Bottom: spectral and pattern selectivity for that type. (G) ROI addition analysis as described for Figure 3J. Left: classifier trained to separate all 6 stimuli. Middle: classifier trained to separate only patterns and disregard wavelength. Right: classifier trained to separate only wavelength and disregard patterns. ∗p < 0.05, Wilcoxon rank sum performed pairwise. n = 4 animals and 1,006 ROIs for AF10; n = 11 animals and 1,134 ROIs for tectum. CK, checkerboard; GR, moving grating; FL, dark flash. |