
|
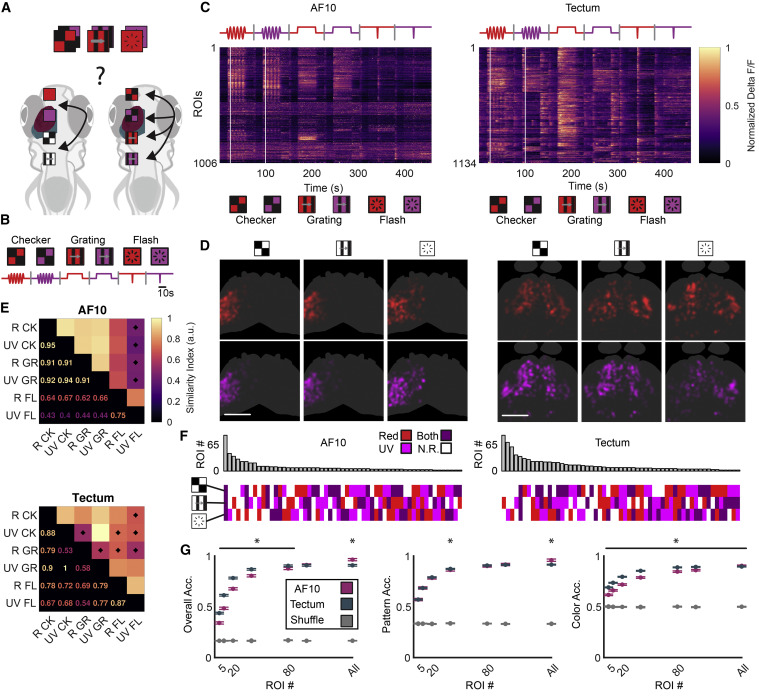
Fig. 4 (A) Red or UV stimuli were utilized to assess whether different spatiotemporal patterns affect wavelength processing between AF10 and tectum. (B) Schematic of the stimuli, combining spatiotemporal patterns with red and UV. (C) Trial-averaged fluorescence traces. Intensity is row-normalized fluorescence. Traces were sorted via hierarchical clustering for display. White lines show the first peak of the checkerboard oscillation. (D) Anatomical interpolated ROI distribution from AF10 (left) and tectum (right), depicted according to the stimulus that elicited the maximum response for that ROI. Scale bars, 100 μm. (E) Anatomical similarity matrix for the response patterns elicited by each stimulus. A star denotes overlap significantly different from inter-trial overlap, Wilcoxon signed rank, p < 0.05. (F) Breakdown of the spectral/pattern types for both populations. Top: count of ROIs of each type. Bottom: spectral and pattern selectivity for that type. (G) ROI addition analysis as described for Figure 3J. Left: classifier trained to separate all 6 stimuli. Middle: classifier trained to separate only patterns and disregard wavelength. Right: classifier trained to separate only wavelength and disregard patterns. ∗p < 0.05, Wilcoxon rank sum performed pairwise. n = 4 animals and 1,006 ROIs for AF10; n = 11 animals and 1,134 ROIs for tectum. CK, checkerboard; GR, moving grating; FL, dark flash.