
Fig. 2
- ID
- ZDB-FIG-210719-16
- Publication
- Guggiana Nilo et al., 2021 - Distributed chromatic processing at the interface between retina and brain in the larval zebrafish
- Other Figures
- All Figure Page
- Back to All Figure Page
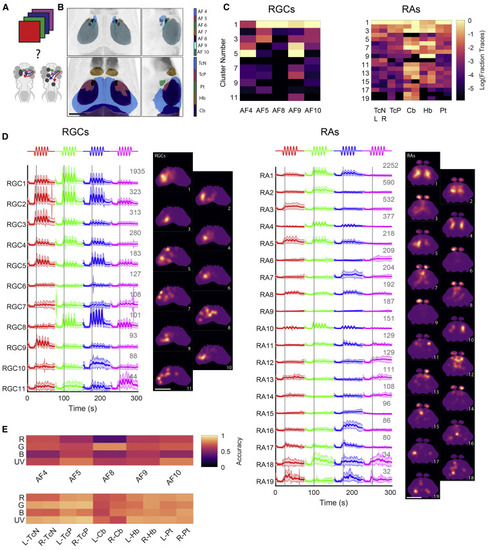
(A) We presented four chromatic stimuli and measured responses from a number of brain regions to identify wavelength-sensitive areas. (B) Anatomical location of the brain regions imaged for the RGC and RA populations. Scale bar, 100 μm. (C) Relative proportion of each cluster found in each of the brain regions imaged (normalized per brain region, plotted as log base 10). (D) Average responses for each cluster, for RGCs (left) and RAs (right). Gray numbers indicate ROI numbers. Maps next to each cluster depict the average location of its ROIs. Gray lines indicate first stimulus peak. Scale bars, 100 μm. (E) Classification accuracy of an SVM classifier trained to discriminate between the stimuli for each region. Top: RGCs; bottom: RAs. AF, arborization field; R- and L-: right and left hemisphere; TcN, tectal neuropil region; TcP, tectal periventricular region; Cb, cerebellum; Hb, habenula; Pt, pretectum. |