
|
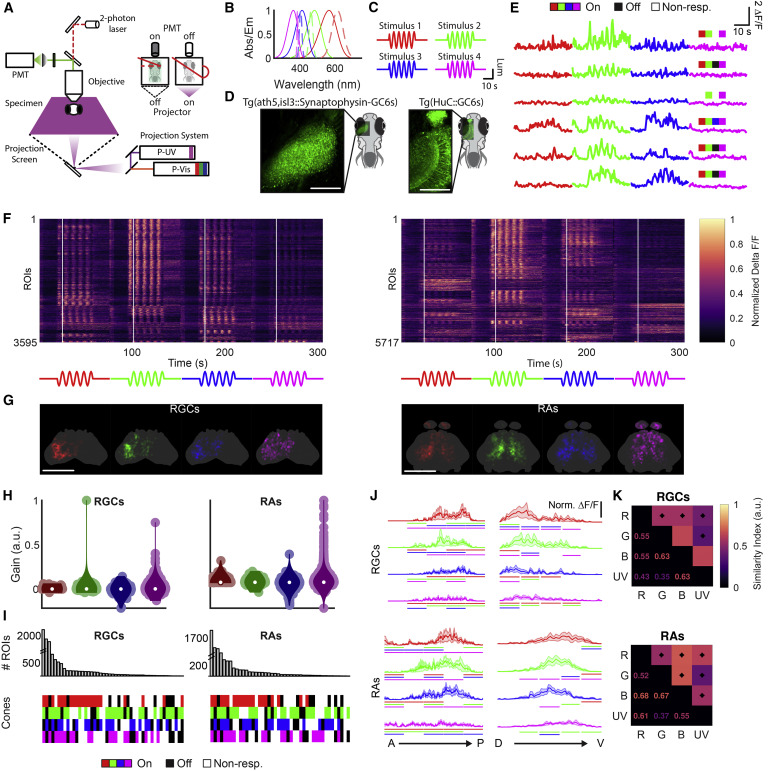
Fig. 1 (A) Schematic of the setup used for stimulation, projecting chromatic stimuli from the bottom using a custom-designed projector with four channels. The inset illustrates alternation between stimulation and recording over the mirror turning cycle. (B) Absorption spectra of the zebrafish cones (solid lines) and emission spectra of the LEDs (dotted lines) used in the projector. (C) Full-field, temporally sinusoidal stimuli. (D) Average images from the isl3/ath5:GCaMP6s and HuC:GCaMP6s lines used to label RGCs and RAs, respectively. Scale bars, 100 μm. (E) Representative delta F/F responses to all four stimuli from RGCs and RAs. Indicated in each trace is the spectral type from (I). (F) Full datasets for RGCs and RAs, with intensity reflecting the row-normalized delta F/F, sorted according to clusters depicted in Figure 2. White lines indicate first stimulus peak. (G) Registered and interpolated anatomical maps of the regions of interest (ROIs), colored by preferred stimulus (see STAR Methods). Scale bars, 100 μm. (H) Calculated gains for each cone from each ROI in RGCs and RAs. (I) Spectral types obtained from categorizing the cone gains from both RGCs and RAs (bottom) and their counts (top). (J) Antero-posterior (left) and dorso-ventral (right) normalized calcium response profiles for RGCs (top) and RAs (bottom) for each stimulus. Lines denote p < 0.05 for difference between the region of the profile covered by the line and the corresponding region in the profile indicated by the line’s color, Wilcoxon signed rank. (K) Spatial similarity of the response patterns elicited by the four stimuli. A star denotes overlap significantly different from monochromatic inter-trial overlap, Wilcoxon signed rank, p < 0.05. n = 6 animals and 3,595 ROIs for the RGC data; n = 6 animals and 5,717 ROIs for the RA data.