FIGURE SUMMARY
Title

Acoustofluidic rotational tweezing enables high-speed contactless morphological phenotyping of zebrafish larvae

Authors
Chen, C., Gu, Y., Philippe, J., Zhang, P., Bachman, H., Zhang, J., Mai, J., Rufo, J., Rawls, J.F., Davis, E.E., Katsanis, N., Huang, T.J.
Source
Full text @ Nat. Commun.

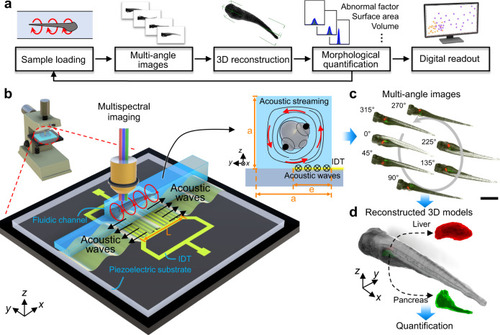
Schematic of the ART system with high-speed 3D multispectral imaging for contactless morphological phenotyping of zebrafish larvae.

a Flow chart of the working mechanism of the ART system. b Illustration of the experimental configuration of the acoustofluidic chip for rotational manipulation of zebrafish larvae mounted on a conventional optical microscope platform. The chip consists of an IDT fabricated on a LiNbO3 piezoelectric substrate which generates acoustic waves and a patterned fluidic channel aligned parallel to the lateral side of the IDT (y axis) with half of its width on the IDT. The zebrafish larvae in the channel can be rotated by polarized acoustic streaming in a single vortex pattern in the yz planes, which was induced by acoustic waves propagating in the ±x direction. The three key parameters contributing to the features of the vortex tube are denoted by “a” for the width of the square cross-section of the channel, “e” for the width of the effective IDT area, and “L” for the length of the IDT. c Multiple labeled organs of the larvae can be imaged using the corresponding fluorescent wavelength during rotation. Scale bar: 1 mm. d From this multi-angle sequence of microscope images, 3D models of different internal organs of interest can be reconstructed, assembled, and quantified as digital readouts using a computer-vision-based algorithm for subsequent quantitative phenotypic analysis of morphological characteristics.

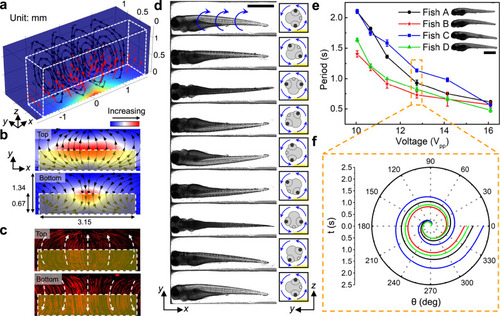
a Results from numerical simulation show that the body force (red arrows) generated by leaky SAWs can induce a vortex streaming pattern within the IDT area. The body force is applied to the liquid above the IDT which is highlighted by the white dashed box. The color of the channel indicates the amplitude of the body force. b Numerical and c experimental demonstration of acoustic streaming in the zebrafish rotation area on the xy-planes close to the channel top and bottom, respectively. The yellow shaded box indicates the IDT area. The experimentally measured streaming pattern (c) represented by the trajectories of 1-μm diameter fluorescent particles, as visualized in a composite of stacked images, matches with the numerically calculated streaming pattern (b) driven by acoustic leaky waves generated by the IDTs. d Image sequence showing a cycle of the rotational motion of a 5 dpf anesthetized zebrafish larva in the acoustofluidic device. The larva was stably rotated counterclockwise with respect to the yz-plane by the fluid-induced drag force. Scale bar: 1 mm. e The rotation periods of four typical 5 dpf zebrafish larvae (length: 3.43–3.6 mm, width: 0.63–0.71 mm) as a function of the driving voltage (Vpp). The rotational periods vary among larvae since each larva has unique characteristics for body shape, size, and density distribution. Overall, the rotational speed of the zebrafish larvae increases as the driving voltage increases. Data are graphed as the mean ± SD (n = 6). Scale bar: 1 mm. f The rotation angle over a single rotational cycle with respect to time for four typical zebrafish larvae at 12.75 Vpp. Source data is available as a source data file.

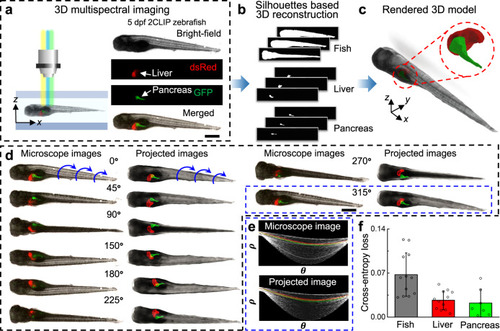
3D multispectral imaging and phenotyping of zebrafish larvae by ART.

a A 5 dpf 2-CLIP zebrafish larva is exposed to a bright-field and corresponding fluorescent illumination during acoustofluidic rotation for multi-view, multispectral observation of the body, liver, and pancreas, respectively. The composite optical image of the bright-field, DsRed, and GFP images of the same larva shows the relative positions of the pancreas and liver within the zebrafish in a lateral view. Scale bar: 500 µm. b The silhouette-based, multi-viewpoint, 3D reconstruction for the zebrafish body, liver, and pancreas at different rotational angles, respectively. c The reconstructed and rendered 3D model which includes the zebrafish body, liver, and pancreas. d Comparison between the optical image sequence and projected 3D model images at the corresponding viewing angles (see Supplementary Video 3 for more detailed comparison). Scale bar: 500 µm. Representative image set of the projected images is from five independent reconstruction calculations (n= 5). e Comparison between the Hough transform plots of the features of the microscope image and the projected image at 315° in (d). No obvious difference is detected between the two Hough transform plots, which means that the reconstructed 3D model is consistent with the optical images of the real zebrafish larva. f The binary cross-entropy loss calculated by comparing microscopic images and the corresponding re-projected images of the 3D reconstructed point clouds from different viewpoints for the fish body, liver, and pancreas. The cross-entropy loss calculates the divergence from the viewpoints with respect to the classification accuracy. n= 12 for fish body and liver, n= 7 for pancreas. Data are graphed as the mean ± SD. Source data is available as a source data file.

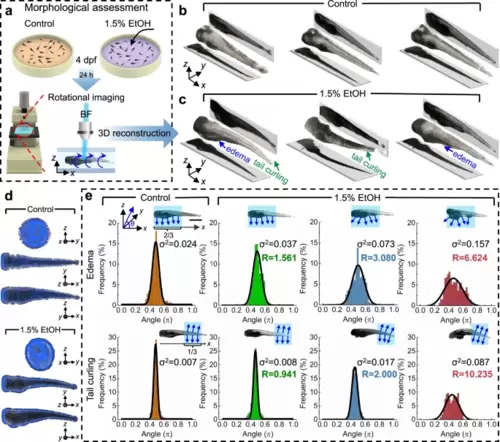
a Zebrafish larvae were raised in egg water containing 1.5% EtOH at 4 dpf and cultured for 24 h. The control group was raised without EtOH exposure for comparison. Both groups of larvae were imaged and digitally reconstructed at 5 dpf to compare and evaluate the morphological abnormalities induced by EtOH. b, c Qualitative 3D morphological assessment of zebrafish larvae by comparing the 3D reconstructed models of three zebrafish larvae from the control group (b) and from the 1.5%-EtOH group (c), respectively. The reconstructed 3D models show that acute EtOH exposure can induce morphological abnormalities in the zebrafish body, which includes edema and tail curling. d Distribution of normal vectors on the surface of reconstructed 3D models of a zebrafish larva from the control group and 1.5%-EtOH group, respectively. e Distributions of the angle (θ) between normal vectors and the x-axis for 3D models of a larva of control group and three larvae of 1.5%-EtOH group with increasing degrees of edema and tail curling. The angles of the anterior two thirds and posterior one third of the larva are calculated to quantify the level of edema and tail curling, respectively. With larger deformations, the angles have a wider distribution based on the histogram and Gaussian fitting curve, as reflected on the value of the variance (σ2). The “abnormality factor” (𝑅=𝜎2/𝜎20) shows the degree of morphological abnormalities by calculating the ratio of variances in the larvae of the 1.5%-EtOH group (σ2) and the averaged variance of the control group (𝜎20𝐸=0.0237±0.0091 and 𝜎20𝑇=0.0085±0.0032; n = 15). Scale bar: 1 mm. Source data is available as a source data file.

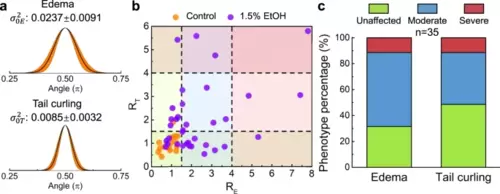
a Gaussian fitting curves of the angle distribution statistics of 15 larvae in the control group. The averaged variances of the angle distribution for edema and tail evaluation are 𝜎20𝐸=0.0237±0.0091 and 𝜎20𝑇=0.0085±0.0032, respectively. b Statistical distribution of the “abnormality factors” (𝑅=𝜎2/𝜎20) for edema and tail curling in the control group (n = 15) and the 1.5%-EtOH group (n = 35). Based on statistical analysis, the larvae within the range of R ≤ 1.5, 1.5 < R ≤ 4, and R > 4 are categorized as unaffected, moderate, and severe, respectively, for morphological abnormality level. c The percentage of phenotype classification (as unaffected, moderate, or severe) of the morphological abnormalities after the 1.5% EtOH exposure. Source data is available as a source data file.

Statistical analysis of zebrafish liver size in response to EtOH exposure.

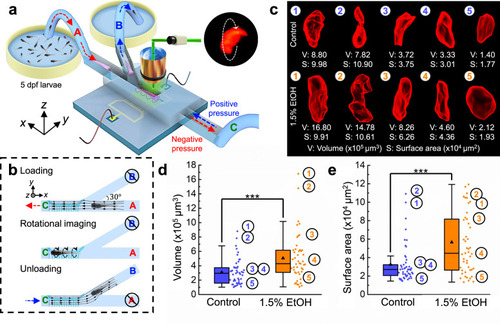
a The schematic shows the setup for imaging zebrafish samples via the semi-automated flow control system of the ART platform. A Y-shape channel enables the successive steps of high-throughput sample loading, rotational imaging, and sample unloading. b Schematic illustrating the channel flow settings for sample loading, rotational imaging, and the unloading processes. Branch C has a negative pressure applied and outlet B is blocked when zebrafish larvae are introduced from inlet A. No pressure is provided to branch C during the rotational imaging process. After rotational imaging, the pressure at branch C is switched to positive and the inlet A is blocked to eject the zebrafish larva through outlet B. The process is repeated continuously until all the larvae have been imaged. c Typical reconstructed 3D models and quantification of five zebrafish livers from the control group and the 1.5%-EtOH group, respectively (see Supplementary Video 6 for 3D models). d, e Statistics of the liver volume distribution and the surface area distribution of the control group and 1.5%-EtOH group, respectively. Based on the statistical analysis, the liver size of the 1.5%-EtOH group is more likely to be larger than that of the control group. This suggests that acute EtOH exposure can induce hepatomegaly in zebrafish larvae. n = 49 and 47 for control and 1.5%-EtOH groups, respectively. (One-way ANOVA, ***P< 0.0005, P = 0.000461 for volume and P = 0.000316 for surface area). All boxplots indicate median (center line), mean (triangle), 25th and 75th percentiles (bounds of box), and ±1.5 × IQR (interquartile range) (whiskers). Source data is available as a source data file.

Acknowledgments
This image is the copyrighted work of the attributed author or publisher, and ZFIN has permission only to display this image to its users. Additional permissions should be obtained from the applicable author or publisher of the image. Full text @ Nat. Commun.