|
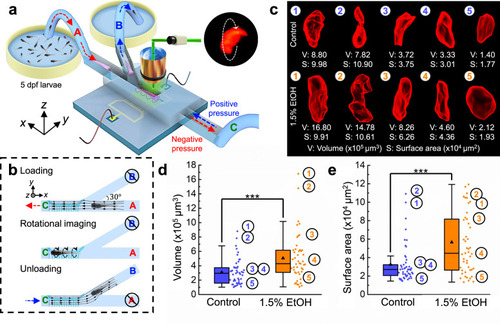
Statistical analysis of zebrafish liver size in response to EtOH exposure.a The schematic shows the setup for imaging zebrafish samples via the semi-automated flow control system of the ART platform. A Y-shape channel enables the successive steps of high-throughput sample loading, rotational imaging, and sample unloading. b Schematic illustrating the channel flow settings for sample loading, rotational imaging, and the unloading processes. Branch C has a negative pressure applied and outlet B is blocked when zebrafish larvae are introduced from inlet A. No pressure is provided to branch C during the rotational imaging process. After rotational imaging, the pressure at branch C is switched to positive and the inlet A is blocked to eject the zebrafish larva through outlet B. The process is repeated continuously until all the larvae have been imaged. c Typical reconstructed 3D models and quantification of five zebrafish livers from the control group and the 1.5%-EtOH group, respectively (see Supplementary Video 6 for 3D models). d, e Statistics of the liver volume distribution and the surface area distribution of the control group and 1.5%-EtOH group, respectively. Based on the statistical analysis, the liver size of the 1.5%-EtOH group is more likely to be larger than that of the control group. This suggests that acute EtOH exposure can induce hepatomegaly in zebrafish larvae. n = 49 and 47 for control and 1.5%-EtOH groups, respectively. (One-way ANOVA, ***P < 0.0005, P = 0.000461 for volume and P = 0.000316 for surface area). All boxplots indicate median (center line), mean (triangle), 25th and 75th percentiles (bounds of box), and ±1.5 × IQR (interquartile range) (whiskers). Source data is available as a source data file.
|