|
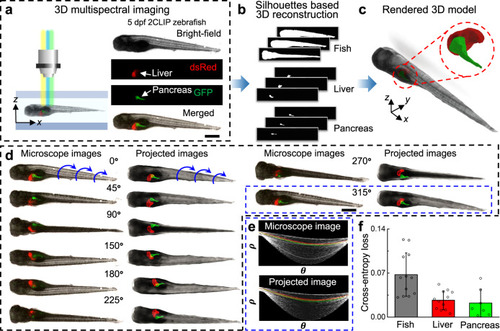
3D multispectral imaging and phenotyping of zebrafish larvae by ART.a A 5 dpf 2-CLIP zebrafish larva is exposed to a bright-field and corresponding fluorescent illumination during acoustofluidic rotation for multi-view, multispectral observation of the body, liver, and pancreas, respectively. The composite optical image of the bright-field, DsRed, and GFP images of the same larva shows the relative positions of the pancreas and liver within the zebrafish in a lateral view. Scale bar: 500 µm. b The silhouette-based, multi-viewpoint, 3D reconstruction for the zebrafish body, liver, and pancreas at different rotational angles, respectively. c The reconstructed and rendered 3D model which includes the zebrafish body, liver, and pancreas. d Comparison between the optical image sequence and projected 3D model images at the corresponding viewing angles (see Supplementary Video 3 for more detailed comparison). Scale bar: 500 µm. Representative image set of the projected images is from five independent reconstruction calculations (n = 5). e Comparison between the Hough transform plots of the features of the microscope image and the projected image at 315° in (d). No obvious difference is detected between the two Hough transform plots, which means that the reconstructed 3D model is consistent with the optical images of the real zebrafish larva. f The binary cross-entropy loss calculated by comparing microscopic images and the corresponding re-projected images of the 3D reconstructed point clouds from different viewpoints for the fish body, liver, and pancreas. The cross-entropy loss calculates the divergence from the viewpoints with respect to the classification accuracy. n = 12 for fish body and liver, n = 7 for pancreas. Data are graphed as the mean ± SD. Source data is available as a source data file.
|