
|
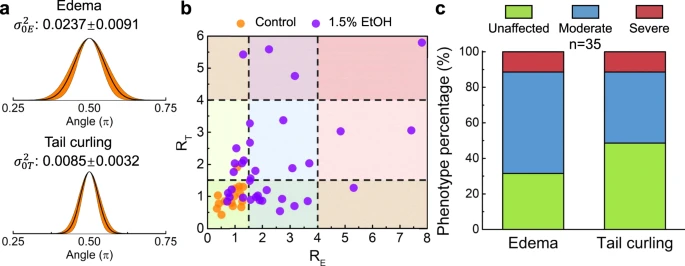
Fig. 5 a Gaussian fitting curves of the angle distribution statistics of 15 larvae in the control group. The averaged variances of the angle distribution for edema and tail evaluation are 𝜎20𝐸=0.0237±0.0091 and 𝜎20𝑇=0.0085±0.0032, respectively. b Statistical distribution of the “abnormality factors” (𝑅=𝜎2/𝜎20) for edema and tail curling in the control group (n = 15) and the 1.5%-EtOH group (n = 35). Based on statistical analysis, the larvae within the range of R ≤ 1.5, 1.5 < R ≤ 4, and R > 4 are categorized as unaffected, moderate, and severe, respectively, for morphological abnormality level. c The percentage of phenotype classification (as unaffected, moderate, or severe) of the morphological abnormalities after the 1.5% EtOH exposure. Source data is available as a source data file.