FIGURE SUMMARY
Title

Regulation of ddb2 expression in blind cavefish and zebrafish reveals plasticity in the control of sunlight-induced DNA damage repair

Authors
Zhao, H., Li, H., Du, J., Di Mauro, G., Lungu-Mitea, S., Geyer, N., Vallone, D., Bertolucci, C., Foulkes, N.S.
Source
Full text @ PLoS Genet.

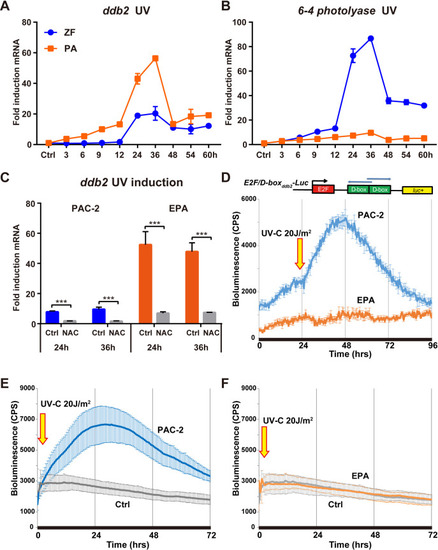
UV responsive <italic>ddb2</italic> gene expression.

(A,B) qRT-PCR analysis of ddb2 (A) and 6–4 photolyase (B) mRNA expression in PAC-2 (ZF) and EPA (PA) cells during a 60-hour period in DD following exposure to a short UV-C pulse (20 J/m2). (C) qRT-PCR analysis in zebrafish and cavefish cells treated with 6 mM N-acetylcysteine (NAC) or vehicle (Ctrl), at 24 hours and 36 hours following a short UV-C pulse (20 J/m2). On the y-axes are plotted the fold induction (± s.d.) of expression with respect to samples subjected to identical treatment but maintained under DD. Times are indicated on the x-axes. Statistical analysis results (Student’s t-test (unpaired, two tailed)) are represented by asterisks (***p<0.001, **p<0.01, *p<0.05) and reported in S1 Table. (D) Bioluminescence analysis of PAC-2 (blue trace) and EPA (orange trace) cells transfected with the E2F/D-boxddb2-Luc reporter, maintained in constant darkness following exposure to a short UV-C light pulse (20 J/m2). (E,F) Comparable bioluminescence analysis of PAC-2 (blue trace) and EPA (orange trace) cells transfected with the ddb2-Luc reporter, maintained in constant darkness following exposure to a short UV-C pulse (20 J/m2). Grey traces in panels E and F represent control (Ctrl) transfected PAC-2 and EPA cells, respectively, that were not treated with UV-C. Each experiment was performed a minimum of three times.

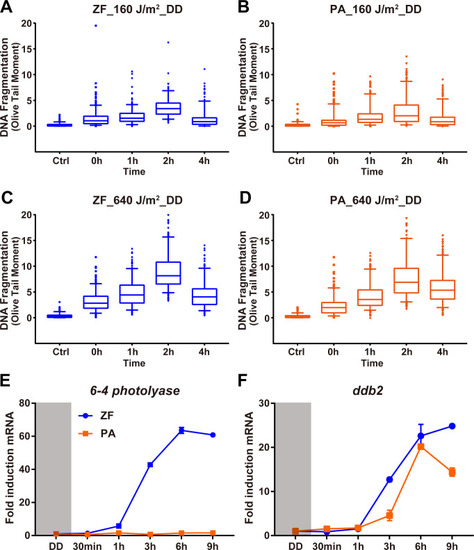
DNA repair of UV induced damage in constant darkness.

(A-D) Comet assay results from zebrafish AB-9 (A, C) and P. andruzzii CF-1 (B, D) cells. Data for levels of DNA fragmentation (Olive Tail Moment) is represented as box plots. The median is given as the central line, with 25th and 75th percentiles as frames. Whiskers indicate the 10th and 90th percentiles. Single outliers are illustrated as dots. Times after UV treatment are indicated on the x axes. (n = 3 experimental units, N = 300 observational units per time point). For each panel, Kruskal-Wallis test followed by Dunn’s multiple comparisons test results are reported in S1 Table. (E,F) Visible light-induced expression of ddb2 in zebrafish and P. andruzzii cells. qRT-PCR analysis of 6–4 photolyase and ddb2 mRNA expression in zebrafish PAC-2 (ZF, blue traces) and P. andruzzii EPA (PA, orange traces) cells during 9 hours of blue light exposure. In each panel, mRNA expression fold induction is plotted on the y-axes as means ± s.d. (n = 3) and times (h and min) are plotted on the x-axes. Each experiment was performed a minimum of three times. Statistical analysis is reported in S1 Table.

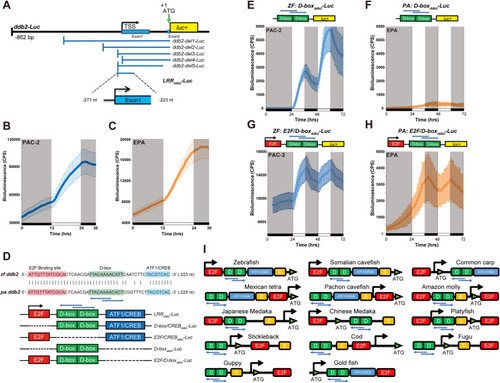
Light-responsive region (LRR) of the <italic>ddb2</italic> promoter.

(A) Above, schematic representation of the zebrafish ddb2-Luc promoter reporter construct. The transcription start site (TSS), ATG translation initiation codon and the luciferase reporter gene (luc+) are indicated. Below, schematic representation of the various zebrafish ddb2 promoter deletion, luciferase reporter constructs analysed. Below is shown the portion of the promoter that constitutes the 49bp LRRddb2 region within the LRRddb2-Luc reporter construct. (B,C) Representative real-time bioluminescence assays in PAC-2 (B) or EPA (C) cells transfected with the ddb2-Luc luciferase reporter. Bioluminescence, counts per second (CPS), is plotted against time (hrs). Black and white bars along the x-axes show dark and light periods, respectively. Each time-point represents the mean of n = 8 ± s.d. (D) Sequence alignment of the LRR promoter region in the zebrafish (zf) and P. andruzzii (pa) ddb2 genes. The E2F, D-box and ATF1/CREB enhancer elements are highlighted in red, green and blue respectively. Vertical bars denote identical sequences in the alignment. Blue horizontal arrows indicate the orientation of the two D-box enhancers. The locations of the aligned sequences in terms of nucleotides upstream from the ATG translation start codon (nt) are indicated on the right side of each sequence (in parentheses). Below: schematic representation of the set of LRRddb2 sub-deletion constructs where each of the enhancer elements in the LRRddb2-Luc reporter is deleted. The E2F, D-box and ATF1/CREB enhancer elements are represented by red, green and blue boxes respectively. (E,F) Above: Schematic representation of the ZF and PA sequence D-boxddb2-Luc reporters. Below: Representative real-time bioluminescence assays from zebrafish PAC-2 (blue trace, left panel) and cavefish EPA cells (orange trace, right panel) transfected with ZF: and PA: D-boxddb2-Luc respectively and exposed to light and dark periods. Bioluminescence (CPS) is plotted on the y-axes and time (hrs) on the x-axes. Each time-point represents the mean of n = 8 ± s.d. White and black bars below each panel represent the light and dark periods, respectively. (G,H) Above: Schematic representation of the ZF and PA E2F/D-boxddb2-Luc reporter constructs. Below: Representative real-time bioluminescence assays from PAC-2 (left panel) and EPA cells (right panel) transfected with ZF: and PA: E2F/D-boxddb2-Luc respectively and exposed to light and dark periods (as described for panel E-F). (I) Schematic representation of the E2F site, D-box and E-box elements as well as ATF1/CREB site present in the promoters of ddb2 genes in various fish species. These elements are conserved in a broad range of fish species (see S2 Table for the Ensembl accession numbers).

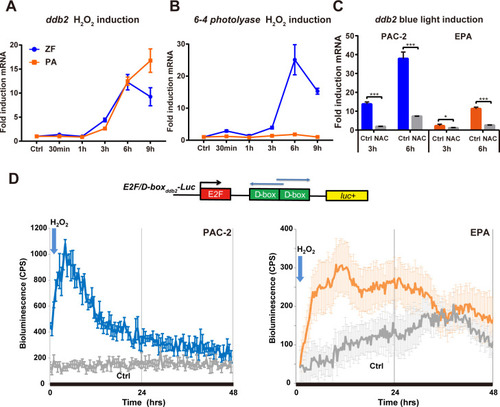
Light regulation of <italic>ddb2</italic> expression via ROS signalling.

(A,B) qRT-PCR analysis in zebrafish PAC-2 (blue traces) and cavefish EPA (orange traces) cells after 300 μM H2O2 treatment. Relative mRNA expression for ddb2 (panel A) and 6–4 photolyase (panel B) are plotted on the y-axes as mean (n = 3) ± s.d.. Times (h and min) are plotted on the x-axes. Two-way ANOVA followed by Sidak’s multiple comparisons test results are reported in S1 Table. (C) qRT-PCR analysis in zebrafish and cavefish cells treated with 6 mM N-acetylcysteine (NAC) or vehicle (Ctrl), following 3 or 6 hours exposure to blue light. On the y-axes are plotted the fold induction (± s.d.) of expression with respect to samples subjected to identical treatment but maintained under DD. Times(hrs) are indicated on the x axes. Statistical analysis results (Student’s t-test (unpaired, two tailed)) are represented by asterisks (***p<0.001, **p<0.01, *p<0.05) and reported in S1 Table. (D) Representative real-time bioluminescence assays from zebrafish PAC-2 (blue trace, left side) and cavefish EPA (orange trace, right side) cells transfected with the E2F/D-boxddb2-Luc reporter (above) and treated in DD with 300 μM H2O2 at the time points indicated by the blue arrows. Grey traces represent control transfected PAC-2 and EPA cells that were not treated with H2O2. Bioluminescence, counts per second (CPS), is plotted against time (hrs). Each time-point represents the mean of n = 8 ± s.d. Each experiment was performed a minimum of three times.

mRNA stability of DNA repair genes following UV radiation.

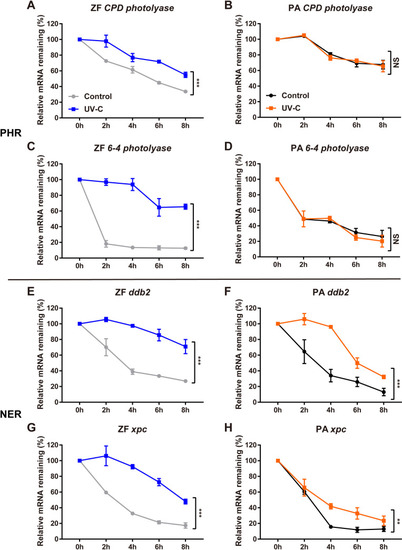
qRT-PCR analysis of CPD photolyase (A,B), 6–4 photolyase (C,D), ddb2 (E,F) and xpc (G,H) mRNA expression levels in PAC-2 (left panels, ZF) and EPA (right panels, PA) cells exposed to a UV-C pulse (20 J/m2), then maintained under constant darkness for 24 hours followed by treatment with actinomycin D (5 μg/ml). On the y axes, relative remaining levels of mRNA (% ± s.d. compared with levels at the onset of the actinomycin D treatment) are plotted (blue or orange traces, UV-C). The results from control samples subjected to actinomycin D treatment and held for the same period in constant darkness but without UV radiation are plotted on the same axes (grey or black traces), in order to compare the mRNA decay for these genes in the presence and absence of on-going transcription. The time points at which samples were taken following the onset of actinomycin D treatment (h) are indicated on the x axes. Statistical analysis of the results is represented by asterisks (***p<0.001, **p<0.01, *p<0.05) and reported in S1 Table.

Acknowledgments
This image is the copyrighted work of the attributed author or publisher, and ZFIN has permission only to display this image to its users. Additional permissions should be obtained from the applicable author or publisher of the image. Full text @ PLoS Genet.