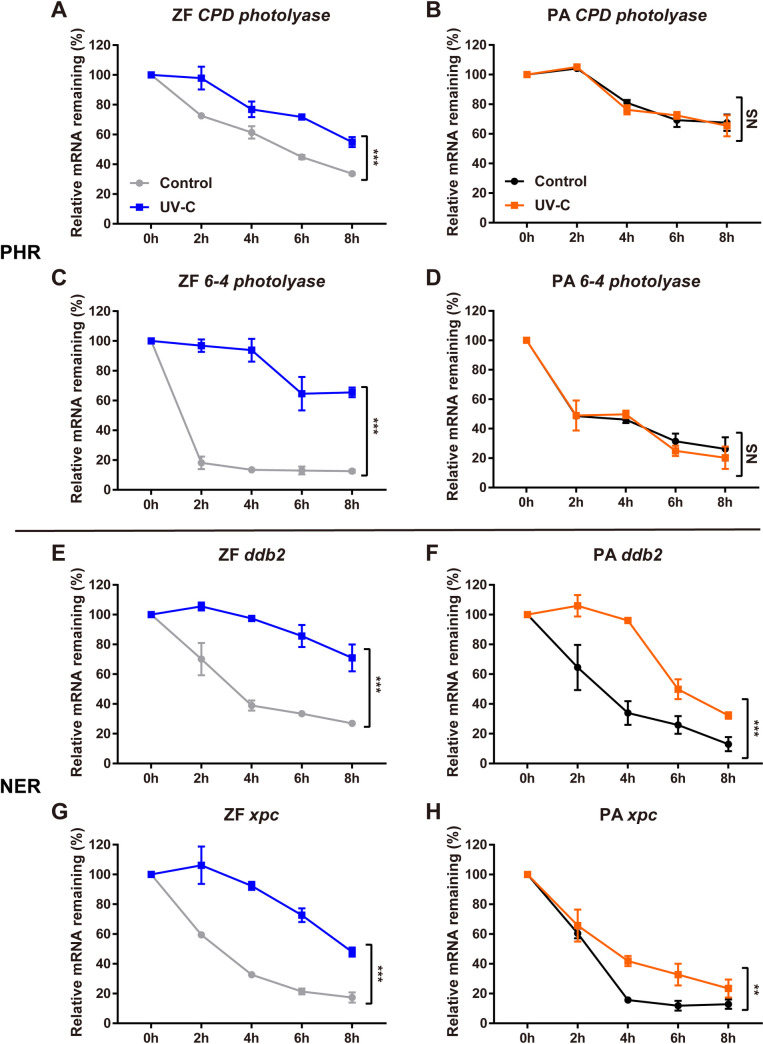
IMAGE

Fig 5

ID
ZDB-IMAGE-210304-9
Source
Figures for Zhao et al., 2021
Image
Figure Caption

Fig 5 mRNA stability of DNA repair genes following UV radiation.

qRT-PCR analysis of CPD photolyase (A,B), 6–4 photolyase (C,D), ddb2 (E,F) and xpc (G,H) mRNA expression levels in PAC-2 (left panels, ZF) and EPA (right panels, PA) cells exposed to a UV-C pulse (20 J/m2), then maintained under constant darkness for 24 hours followed by treatment with actinomycin D (5 μg/ml). On the y axes, relative remaining levels of mRNA (% ± s.d. compared with levels at the onset of the actinomycin D treatment) are plotted (blue or orange traces, UV-C). The results from control samples subjected to actinomycin D treatment and held for the same period in constant darkness but without UV radiation are plotted on the same axes (grey or black traces), in order to compare the mRNA decay for these genes in the presence and absence of on-going transcription. The time points at which samples were taken following the onset of actinomycin D treatment (h) are indicated on the x axes. Statistical analysis of the results is represented by asterisks (***p<0.001, **p<0.01, *p<0.05) and reported in S1 Table.

Acknowledgments
This image is the copyrighted work of the attributed author or publisher, and ZFIN has permission only to display this image to its users. Additional permissions should be obtained from the applicable author or publisher of the image. Full text @ PLoS Genet.