IMAGE

Fig 3

ID
ZDB-IMAGE-210304-7
Source
Figures for Zhao et al., 2021
Image
Figure Caption

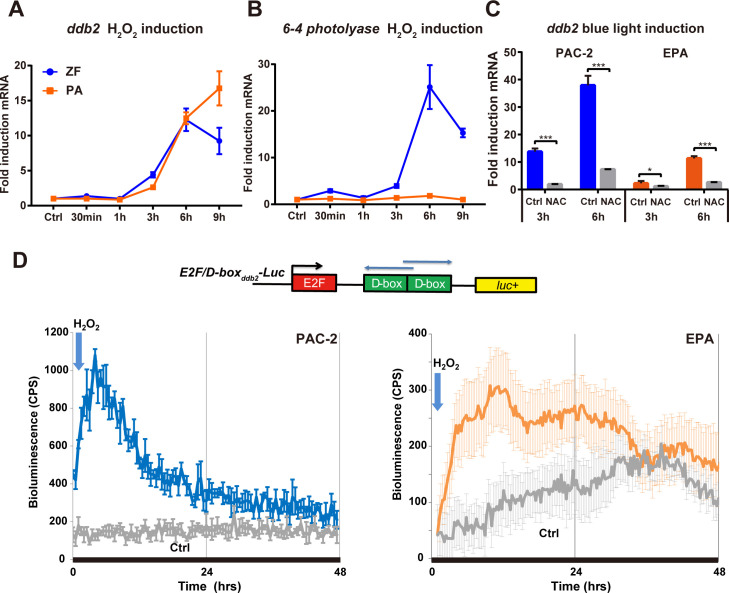
Fig 3 Light regulation of <italic>ddb2</italic> expression via ROS signalling.

(A,B) qRT-PCR analysis in zebrafish PAC-2 (blue traces) and cavefish EPA (orange traces) cells after 300 μM H2O2 treatment. Relative mRNA expression for ddb2 (panel A) and 6–4 photolyase (panel B) are plotted on the y-axes as mean (n = 3) ± s.d.. Times (h and min) are plotted on the x-axes. Two-way ANOVA followed by Sidak’s multiple comparisons test results are reported in S1 Table. (C) qRT-PCR analysis in zebrafish and cavefish cells treated with 6 mM N-acetylcysteine (NAC) or vehicle (Ctrl), following 3 or 6 hours exposure to blue light. On the y-axes are plotted the fold induction (± s.d.) of expression with respect to samples subjected to identical treatment but maintained under DD. Times(hrs) are indicated on the x axes. Statistical analysis results (Student’s t-test (unpaired, two tailed)) are represented by asterisks (***p<0.001, **p<0.01, *p<0.05) and reported in S1 Table. (D) Representative real-time bioluminescence assays from zebrafish PAC-2 (blue trace, left side) and cavefish EPA (orange trace, right side) cells transfected with the E2F/D-boxddb2-Luc reporter (above) and treated in DD with 300 μM H2O2 at the time points indicated by the blue arrows. Grey traces represent control transfected PAC-2 and EPA cells that were not treated with H2O2. Bioluminescence, counts per second (CPS), is plotted against time (hrs). Each time-point represents the mean of n = 8 ± s.d. Each experiment was performed a minimum of three times.

Acknowledgments
This image is the copyrighted work of the attributed author or publisher, and ZFIN has permission only to display this image to its users. Additional permissions should be obtained from the applicable author or publisher of the image. Full text @ PLoS Genet.