|
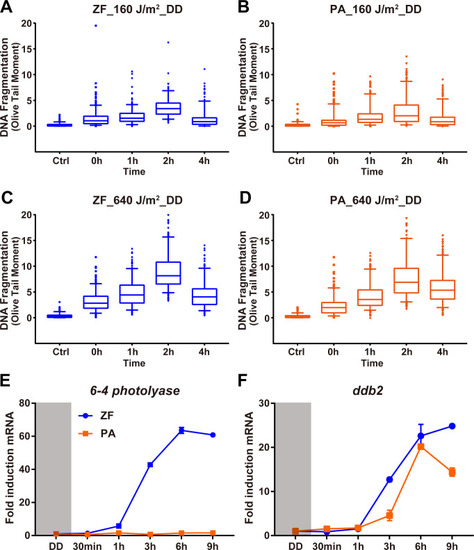
DNA repair of UV induced damage in constant darkness.(A-D) Comet assay results from zebrafish AB-9 (A, C) and P. andruzzii CF-1 (B, D) cells. Data for levels of DNA fragmentation (Olive Tail Moment) is represented as box plots. The median is given as the central line, with 25th and 75th percentiles as frames. Whiskers indicate the 10th and 90th percentiles. Single outliers are illustrated as dots. Times after UV treatment are indicated on the x axes. (n = 3 experimental units, N = 300 observational units per time point). For each panel, Kruskal-Wallis test followed by Dunn’s multiple comparisons test results are reported in S1 Table. (E,F) Visible light-induced expression of ddb2 in zebrafish and P. andruzzii cells. qRT-PCR analysis of 6–4 photolyase and ddb2 mRNA expression in zebrafish PAC-2 (ZF, blue traces) and P. andruzzii EPA (PA, orange traces) cells during 9 hours of blue light exposure. In each panel, mRNA expression fold induction is plotted on the y-axes as means ± s.d. (n = 3) and times (h and min) are plotted on the x-axes. Each experiment was performed a minimum of three times. Statistical analysis is reported in S1 Table.
|