FIGURE SUMMARY
Title

In situ differentiation of iridophore crystallotypes underlies zebrafish stripe patterning

Authors
Gur, D., Bain, E.J., Johnson, K.R., Aman, A.J., Pasoili, H.A., Flynn, J.D., Allen, M.C., Deheyn, D.D., Lee, J.C., Lippincott-Schwartz, J., Parichy, D.M.
Source
Full text @ Nat. Commun.

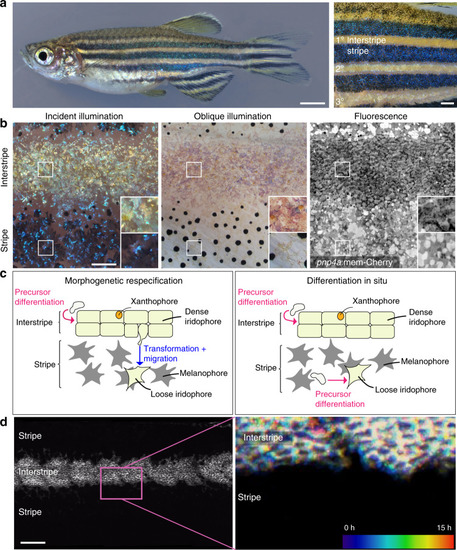
Anatomy, development, and models of zebrafish adult pigment patterning.

a Left panel, an adult zebrafish showing light interstripes with intervening dark stripes. Right panel, a closeup showing the primary interstripe (1°) which develops first with stripes above and below, followed by secondary interstripes ventrally (2°) and dorsally with additional stripes, and ultimately a tertiary (3°) interstripe and stripe. b Closeups of first-forming 1° interstripe and stripes, illustrating overall pattern features, as well as morphologies and arrangements of iridophores. All panels are the same location in a single animal. Left panel is incident illumination showing iridescence of iridophore-reflecting platelets with yellowish tinge in the interstripe and bluish tinge in the stripe. Center panel is oblique illumination revealing surface features and non-iridescent colors of iridophores. Here, the fish has been treated with epinephrine to contract melanin granules of melanophores and pigment within xanthophores toward cell centers26, thereby better revealing iridophore morphologies. Right panel is membrane-targeted mCherry (mem-Cherry) driven at high levels in iridophores by regulatory elements of purine nucleoside phosphorylase 4a (pnp4a)18,23,59, revealing iridophore cell boundaries and arrangements. Pixel values are inverted for easier comparison to bright field images. Example shown is representative of >20 individual fish examined. c Two models for iridophore patterning in interstripes and stripes. In the morphogenetic respecification model (left panel), initially densely packed, cuboidal iridophores begin adopting a loose morphology as they and their progeny migrate out to populate the prospective stripe. In the differentiation in situ model (right panel), iridophores residing in interstripes and stripes are different cell types that have differentiated “in place” from a precursor population. Hence, loose iridophores in stripes are not lineally related to dense iridophores in interstripes. d The flank of a 7.5 standardized standard length (SSL)24pnp4a:mem-Cherry fish. Left panel, fluorescence image showing the arrangement of labeled cells in the dense primary interstripe. Right panel, pseudo-temporal coloring representation of a 15 h time-lapse movie (zoomed to the region outlined in “d”) revealing that interstripe iridophores migrate primarily in the anteroposterior direction, with no apparent dorsoventral migration into the stripe region. Example image is representative of time-lapse videos from a total of 10 individuals during primary stripe formation at 7.0–7.5 SSL, as well as 15 individuals during secondary stripe formation at 10.0–12.0 SSL. Scale bars, a 2 mm, b 500 µm, d 500 µm.

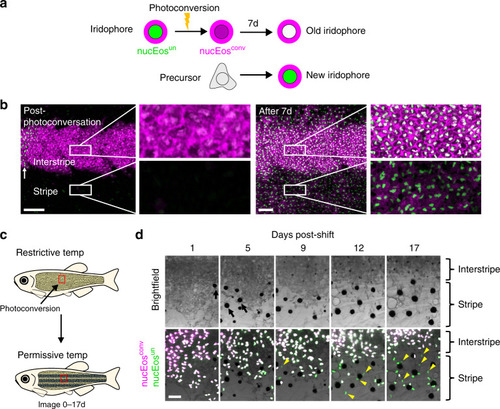
Photoconversion experiments to test models of pattern development and remodeling.

a Fish were generated to have iridophores expressing nuclear-localizing Eos (nucEosun, green) and a membrane-targeted mCherry (mem-Cherry, magenta) driven by regulatory elements of pnp4a. Following photoconversion of an iridophore population, the converted nuclei will appear magenta (nucEoscon). After 7 days, previously photoconverted nuclei will appear white (due to the combination of “new” green proteins and “old” magenta proteins), whereas nuclei of newly differentiated cells will appear green. b Tracking photoconverted iridophores in the interstripe revealed that stripe iridophores do not derive from the interstripe population. Following photoconversion of a region in the primary interstripe of a fish at 7.5 SSL, all nuclei appeared magenta (post-photoconversion), with surrounding mem-Cherry-labeled plasma membrane magenta-colored as well (left panel). After 7 days of additional development (8.6 SSL), at which time iridophores had populated the primary stripe, only nuclei with green signal were seen in the stripe zone, whereas interstripe nuclei were primarily white (right panel). Higher magnification images of boxed regions, show interstripe iridophores that retained nucEosconv, while also acquiring new nucEosun (making their nuclei white; upper inset, right panel). Stripe iridophores, by contrast, lacked nucEosconv and expressed only nucEosun (making their nuclei green; lower inset, right panel). Example shown is representative of a total of eight individual fish examined. c Use of a temperature-sensitive mitfavc7 allele to examine the effect of conditional melanophore development on iridophore pattern remodeling. For this experiment, iridophores were labeled only with a nuclear-localizing Eos (nucEosun, green; nucEosconv, magenta); after photoconversion nuclei appear magenta, or white as new nucEosun was produced. d Brightfield (upper) and fluorescence superimposed on bright field (lower) following photoconversion and shift to permissive temperature to drive onset of melanophore differentiation. Iridophores labeled by nucEos expression were photoconverted at the beginning of the experiment and followed over 17 days to distinguish newly differentiating iridophores (green) from previously differentiated iridophores (white). As melanophores differentiated (see yellow arrows in top panel), the region of dense morphology iridophores receded dorsally. This change was accompanied by differentiation of new iridophores having green nuclei (see yellow arrowheads in bottom panel) in the newly forming stripe. Example shown is representative of a total of 12 individuals across two independent experiments. Scale bars, b 100 µm, d 50 µm.

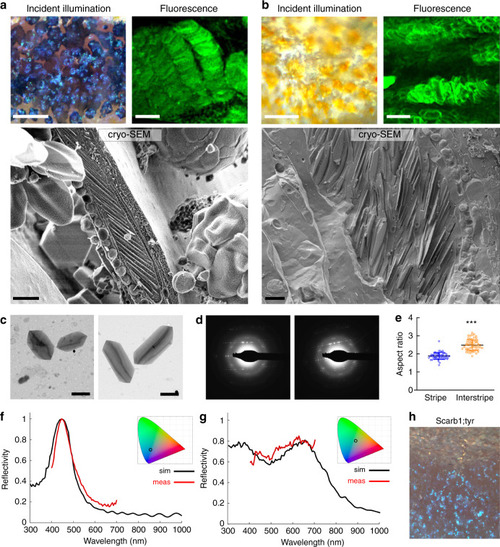
Loose versus dense iridophores have distinct crystal morphologies and ultrastructural organizations, but shared chemistry.

a Loose iridophores in stripe region viewed by incident illumination, fluorescence, and high pressure–frozen, freeze-fractured cryo-SEM (Cryo-SEM). The incident illumination image shows blue iridophores on top of black melanophores; the fluorescent image reveals malachite green (MG) labeled iridophores (pseudo colored green) with highly ordered arrays of guanine crystals; and the Cryo-SEM image shows iridophore cytoplasm with highly disordered arrays of crystals. n = 5 adult fish for incident illumination and fluorescence, and n = 4 adult fish for cryo-SEM. b Dense iridophores in interstripe region viewed by incident illumination, fluorescence, and Cryo-SEM. The incident illumination image shows silvery iridophores covered by yellow xanthophores; the fluorescent image reveals MG-labeled iridophores with disordered arrays of guanine crystals (pseudo colored green); and the high pressure–frozen, freeze-fractured cryo-SEM micrograph shows iridophore cytoplasm with disordered arrangements of crystals. n = 5 adult fish for incident illumination and fluorescence, and n = 4 adult fish for cryo-SEM. ce TEM analysis of crystals isolated from iridophores from either the stripe or the interstripe regions of adult fish (n = 4 adult fish). c TEM micrographs of crystals isolated from stripe (left panel) and interstripe regions (right panel); d TEM-based electron diffraction of the crystals shown in Supplementary Fig. 7, isolated from stripe iridophores (left panel) and interstripe iridophores (right panel); e graph of aspect ratio (length/width) of stripe iridophores (blue) and interstripe iridophores (orange), n = 60 for stripe isolated crystals and n = 57 for interstripe isolated crystals, Data are represented as mean ± SEM. The p value, p < 0.0001, was determined using two-tailed Mann–Whitney test. f Simulated reflection (black) and measured reflection (red) from a stripe iridophore. g Simulated reflection (black) and measured reflection (red) from an interstripe iridophore. Insets in both f and g show the corresponding reflectance color on a CIE (International Commission on Illumination) chromaticity space diagram. h Incident illumination image of an adult fish lacking melanin in melanophores and carotenoids in xanthophores due to mutations in tyrosinase and scarb1, respectively. The image shows iridophore-type-specific coloration is independent of melanin and carotenoids, consistent with reflectance data obtained for stripe (f) and interstipe iridophores (g). Scale bars, a, b (left panels) 50 μm, a, b (right panels) 4 μm, a, b (bottom panels) 1.5 μm, c 2 μm.

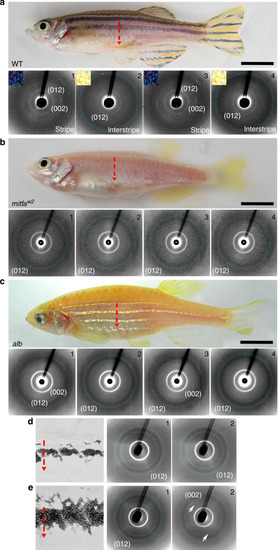
Disordered- and ordered-crystal-containing iridophores remain distinct throughout development.

a Upper panel shows wild-type zebrafish with the red vertical dotted arrow showing, where X-ray diffraction measurements were made. Lower panels 1 through 4 show X-ray diffraction pattern measurements in stripe and interstripe regions, with upper left insets showing the incident illumination differences in these regions. Diffraction patterns collected in the stripe regions (1 and 3) had low-angular distributions with a punctuated-like signal, indicating iridophore crystals in these regions are parallel to one another. Diffraction patterns collected in the interstripe regions (2 and 4), by contrast, exhibited high-angular distributions with a full-ring signal, indicating iridophore crystals in these regions are not well aligned. n = 3 different fish. b X-ray diffraction measurements as in a made in mitfaw2 mutant fish, using a vertical line scan across the trunk of the fish. The typical diffraction pattern of the ordered stripe iridophore is missing in this line scan, and the observed diffractions are of high-angular distribution (“full ring”). n = 3 different fish. c X-ray diffraction measurements as in a from albino mutant (alb). The overall diffraction pattern resembles that of wild-type fish, with highly ordered diffraction patterns of the (002) and (012) diffraction planes throughout the stripe regions (1 and 3), and high-angular distribution of only the (012) diffraction plane throughout the interstripe regions (2 and 4). n = 3 different fish. d, e X-ray diffraction patterns from vertical lines measured across the trunk of ~6 SSL (d) and ~6.9 SSL (e) wild-type zebrafish. Left panels, illustrate representative individuals and iridophore patterns from repeated image series (e.g., Supplementary Fig. 4). Panels 1 and 2 show X-ray diffraction patterns from areas in the 1° interstripe and adjacent to the 1° interstripe, respectively. In d, both regions show a high-angular distribution of the (012) diffraction plane. In e, a low-angular distribution diffraction of the (002) plane (2) is visible (white arrows) just adjacent to the first interstripe region (1). n = 3 different fish. Scale bars, ac 4 mm.

Disordered- and ordered-crystal-containing iridophores exhibit distinct transcriptomic signatures and response to stimuli.

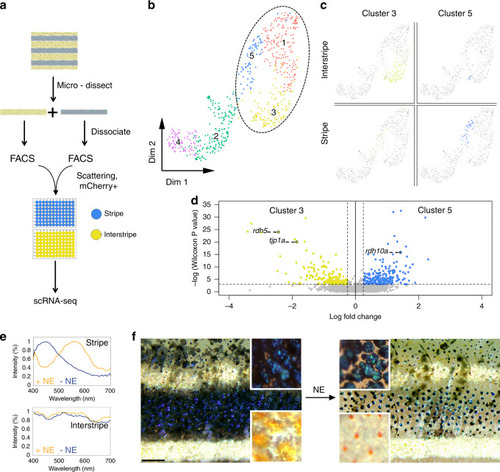
a Experimental design of single-cell RNA-sequencing experiment. b Two-dimensional UMAP representation of the collected skin cell clusters (dashed ellipse marks iridophores). c Anatomical origin (stripe versus interstripe) of iridophores from clusters 5 (blue) and 3 (yellow). d A volcano representation of differentially expressed genes between clusters 5 (blue) and 3 (yellow), where 192 genes were upregulated in cluster 5 and 158 were upregulated in cluster 3. e, f The response of an adult zebrafish skin pattern to norepinephrine (NE) stimulation. e The optical response of individual iridophores from the stripe (upper panel) and interstripe (lower panel). In the stripe, the reflection peak of an ordered iridophore shifts from ~450 to ~570 nm upon NE treatment. In the interstripe, only minor changes in the reflection spectra occur in response to NE. n = 4 different fish (f) illustrates optical response from relaxed, untreated fish (−NE) to the treated fish (+NE). Note the differences between the blue stripe and the two-flanking yellow interstripes and how this changed with NE treatment. Before treatment, a deep blue color for the stripe region and a golden-yellow color for the interstripe region is observed. After NE treatment, the contrast between the stripe and the interstripe is drastically reduced. This color change arises because NE causes pigment granules within the melanophores in the stripe to aggregate in the cell center and blue iridophore reflectance to shift from a dark-blue to green-yellow hue (see upper insets), while in the interstripe, NE causes the pigment granules within the xanthophores to aggregate and silvery iridophores to have only a minor color change (lower insets), n = 3 different fish. Scale bar, f 400 μm.

Acknowledgments
This image is the copyrighted work of the attributed author or publisher, and ZFIN has permission only to display this image to its users. Additional permissions should be obtained from the applicable author or publisher of the image. Full text @ Nat. Commun.