|
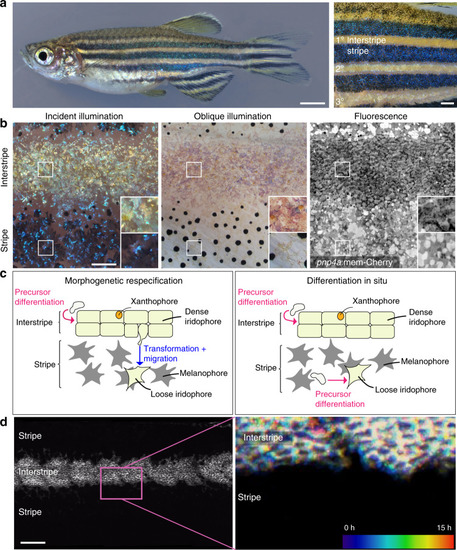
Anatomy, development, and models of zebrafish adult pigment patterning.a Left panel, an adult zebrafish showing light interstripes with intervening dark stripes. Right panel, a closeup showing the primary interstripe (1°) which develops first with stripes above and below, followed by secondary interstripes ventrally (2°) and dorsally with additional stripes, and ultimately a tertiary (3°) interstripe and stripe. b Closeups of first-forming 1° interstripe and stripes, illustrating overall pattern features, as well as morphologies and arrangements of iridophores. All panels are the same location in a single animal. Left panel is incident illumination showing iridescence of iridophore-reflecting platelets with yellowish tinge in the interstripe and bluish tinge in the stripe. Center panel is oblique illumination revealing surface features and non-iridescent colors of iridophores. Here, the fish has been treated with epinephrine to contract melanin granules of melanophores and pigment within xanthophores toward cell centers26, thereby better revealing iridophore morphologies. Right panel is membrane-targeted mCherry (mem-Cherry) driven at high levels in iridophores by regulatory elements of purine nucleoside phosphorylase 4a (pnp4a)18,23,59, revealing iridophore cell boundaries and arrangements. Pixel values are inverted for easier comparison to bright field images. Example shown is representative of >20 individual fish examined. c Two models for iridophore patterning in interstripes and stripes. In the morphogenetic respecification model (left panel), initially densely packed, cuboidal iridophores begin adopting a loose morphology as they and their progeny migrate out to populate the prospective stripe. In the differentiation in situ model (right panel), iridophores residing in interstripes and stripes are different cell types that have differentiated “in place” from a precursor population. Hence, loose iridophores in stripes are not lineally related to dense iridophores in interstripes. d The flank of a 7.5 standardized standard length (SSL)24pnp4a:mem-Cherry fish. Left panel, fluorescence image showing the arrangement of labeled cells in the dense primary interstripe. Right panel, pseudo-temporal coloring representation of a 15 h time-lapse movie (zoomed to the region outlined in “d”) revealing that interstripe iridophores migrate primarily in the anteroposterior direction, with no apparent dorsoventral migration into the stripe region. Example image is representative of time-lapse videos from a total of 10 individuals during primary stripe formation at 7.0–7.5 SSL, as well as 15 individuals during secondary stripe formation at 10.0–12.0 SSL. Scale bars, a 2 mm, b 500 µm, d 500 µm.
|