|
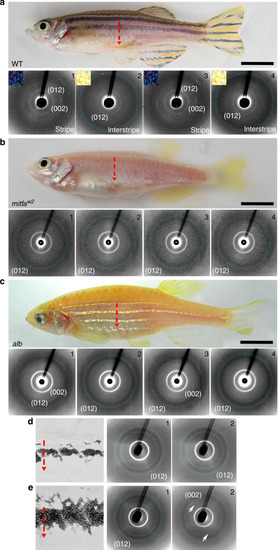
Disordered- and ordered-crystal-containing iridophores remain distinct throughout development.a Upper panel shows wild-type zebrafish with the red vertical dotted arrow showing, where X-ray diffraction measurements were made. Lower panels 1 through 4 show X-ray diffraction pattern measurements in stripe and interstripe regions, with upper left insets showing the incident illumination differences in these regions. Diffraction patterns collected in the stripe regions (1 and 3) had low-angular distributions with a punctuated-like signal, indicating iridophore crystals in these regions are parallel to one another. Diffraction patterns collected in the interstripe regions (2 and 4), by contrast, exhibited high-angular distributions with a full-ring signal, indicating iridophore crystals in these regions are not well aligned. n = 3 different fish. b X-ray diffraction measurements as in a made in mitfaw2 mutant fish, using a vertical line scan across the trunk of the fish. The typical diffraction pattern of the ordered stripe iridophore is missing in this line scan, and the observed diffractions are of high-angular distribution (“full ring”). n = 3 different fish. c X-ray diffraction measurements as in a from albino mutant (alb). The overall diffraction pattern resembles that of wild-type fish, with highly ordered diffraction patterns of the (002) and (012) diffraction planes throughout the stripe regions (1 and 3), and high-angular distribution of only the (012) diffraction plane throughout the interstripe regions (2 and 4). n = 3 different fish. d, e X-ray diffraction patterns from vertical lines measured across the trunk of ~6 SSL (d) and ~6.9 SSL (e) wild-type zebrafish. Left panels, illustrate representative individuals and iridophore patterns from repeated image series (e.g., Supplementary Fig. 4). Panels 1 and 2 show X-ray diffraction patterns from areas in the 1° interstripe and adjacent to the 1° interstripe, respectively. In d, both regions show a high-angular distribution of the (012) diffraction plane. In e, a low-angular distribution diffraction of the (002) plane (2) is visible (white arrows) just adjacent to the first interstripe region (1). n = 3 different fish. Scale bars, a–c 4 mm.
|