IMAGE

Fig. 2

ID
ZDB-IMAGE-210101-3
Source
Figures for Gur et al., 2020
Image
Figure Caption

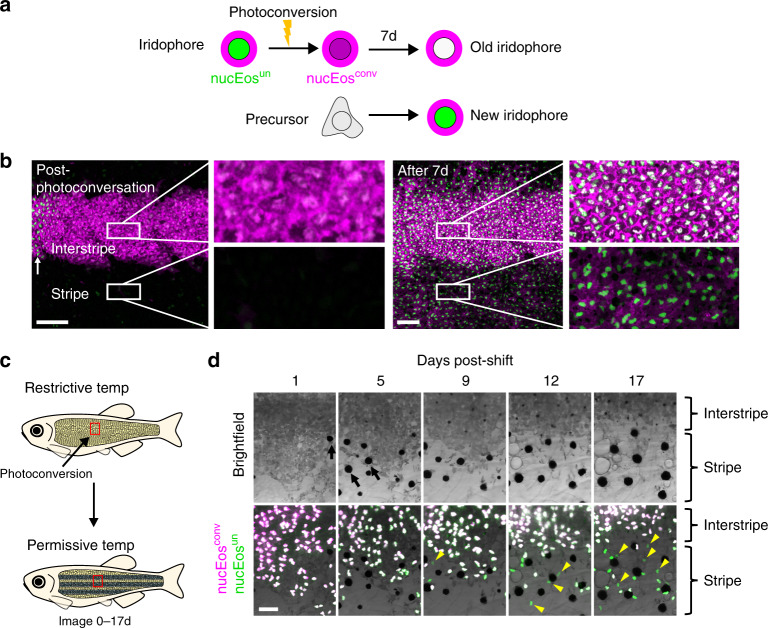
Fig. 2 Photoconversion experiments to test models of pattern development and remodeling.

a Fish were generated to have iridophores expressing nuclear-localizing Eos (nucEosun, green) and a membrane-targeted mCherry (mem-Cherry, magenta) driven by regulatory elements of pnp4a. Following photoconversion of an iridophore population, the converted nuclei will appear magenta (nucEoscon). After 7 days, previously photoconverted nuclei will appear white (due to the combination of “new” green proteins and “old” magenta proteins), whereas nuclei of newly differentiated cells will appear green. b Tracking photoconverted iridophores in the interstripe revealed that stripe iridophores do not derive from the interstripe population. Following photoconversion of a region in the primary interstripe of a fish at 7.5 SSL, all nuclei appeared magenta (post-photoconversion), with surrounding mem-Cherry-labeled plasma membrane magenta-colored as well (left panel). After 7 days of additional development (8.6 SSL), at which time iridophores had populated the primary stripe, only nuclei with green signal were seen in the stripe zone, whereas interstripe nuclei were primarily white (right panel). Higher magnification images of boxed regions, show interstripe iridophores that retained nucEosconv, while also acquiring new nucEosun (making their nuclei white; upper inset, right panel). Stripe iridophores, by contrast, lacked nucEosconv and expressed only nucEosun (making their nuclei green; lower inset, right panel). Example shown is representative of a total of eight individual fish examined. c Use of a temperature-sensitive mitfavc7 allele to examine the effect of conditional melanophore development on iridophore pattern remodeling. For this experiment, iridophores were labeled only with a nuclear-localizing Eos (nucEosun, green; nucEosconv, magenta); after photoconversion nuclei appear magenta, or white as new nucEosun was produced. d Brightfield (upper) and fluorescence superimposed on bright field (lower) following photoconversion and shift to permissive temperature to drive onset of melanophore differentiation. Iridophores labeled by nucEos expression were photoconverted at the beginning of the experiment and followed over 17 days to distinguish newly differentiating iridophores (green) from previously differentiated iridophores (white). As melanophores differentiated (see yellow arrows in top panel), the region of dense morphology iridophores receded dorsally. This change was accompanied by differentiation of new iridophores having green nuclei (see yellow arrowheads in bottom panel) in the newly forming stripe. Example shown is representative of a total of 12 individuals across two independent experiments. Scale bars, b 100 µm, d 50 µm.

Acknowledgments
This image is the copyrighted work of the attributed author or publisher, and ZFIN has permission only to display this image to its users. Additional permissions should be obtained from the applicable author or publisher of the image. Full text @ Nat. Commun.