
- Title
-
Postembryonic screen for mutations affecting spine development in zebrafish
- Authors
- Gray, R.S., Gonzalez, R., Ackerman, S.D., Minowa, R., Griest, J.F., Bayrak, M.N., Troutwine, B., Canter, S., Monk, K.R., Sepich, D.S., Solnica-Krezel, L.
- Source
- Full text @ Dev. Biol.
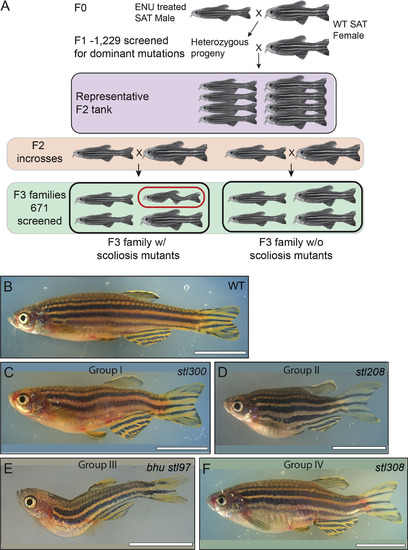
Representative phenotypes of the spine defect mutant classes at post-metamorphic stages. (A) Schematic of forward genetic screen. Brightfield pictures of wild type (B) and representative mutants (C–F), displaying whole-body scoliosis (C, Group I), dwarf or shortened body plan (D, Group II), thoracic-localized scoliosis (E, Group III), or caudal-localized scoliosis (F, Group IV). Scale bars, 1 cm, except E, which is 5 mm. |
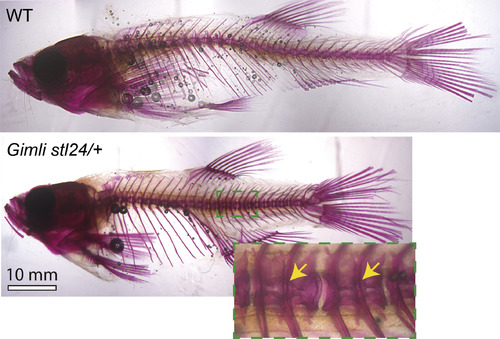
Representative group V dominant mutant displaying vertebral fusions. Alizarin-red stained skeletal preparations illustrate representative phenotypes from stl24/ + Gimli. PHENOTYPE:
|
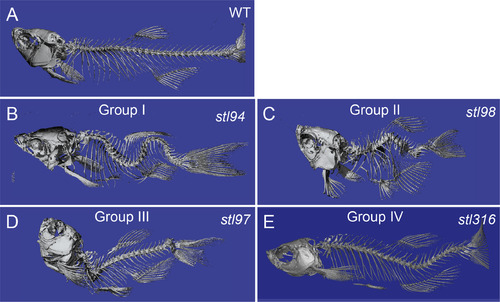
Micro-computed tomography imaging of the representative spine defect mutant classes. μCT imaging of wild type (A) and representative mutants (B–E), displaying whole-body scoliosis (stl94) (B, Group I), dwarf or shortened body plan and vertebral body defects (stl98) (C, Group II), thoracic-localized scoliosis (bhustl97) (D, Group III), and caudal-localized scoliosis locstl316 (E, Group IV). |
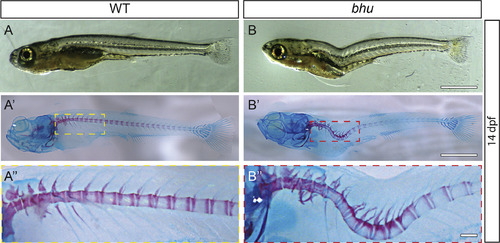
The bhustl97 mutation generates a thoracic-localized lordosis during larval development. Bright field imaging of representative WT (A-A″) and bhustl97/stl97 (B–B″) at 14 dpf shown as both unstained (A, B) and Alizarin-Red and Alcian-Blue stained larvae (A′-A″, B′-B″). Scale bars, 1 mm.) PHENOTYPE:
|
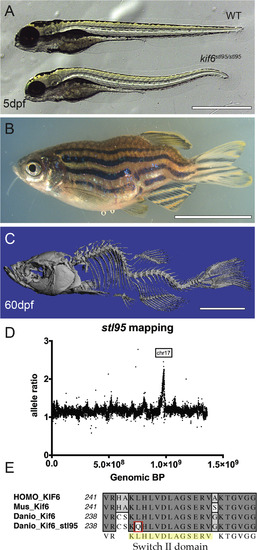
The kif6stl95 mutant displays early notochord bending and larval onset scoliosis with rotation, without obvious vertebral malformations. Bright field of representative sibling WT and mutant kif6stl95/stl95 phenotypes at 5 dpf (A) and mutant adult at 60 dpf (B). μCT imaging of a kif6stl95/stl95 mutant at 60 dpf (C). Region of homozygosity-based mapping graphed as mutant allele ratio over the total genomic distance shows a peak of homozygosity at Chromosome 17 (D). Multi-species alignment of the switch II domain of Kif6 proteins illustrating the amino acid change in the kif6stl95/stl95 mutant to Glutamine from a well-conserved Leucine residue (E). Scale bars (A), 1 mm and (B, C), 1 cm. PHENOTYPE:
|
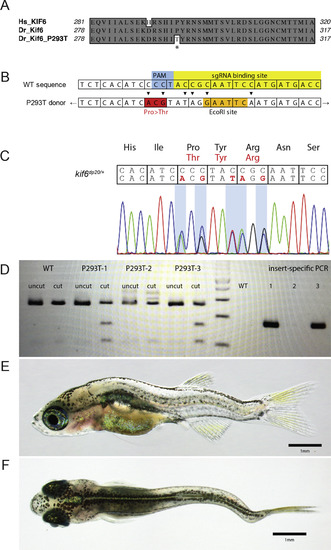
Generation of a novel kif6 p.P293T mutant zebrafish. (A) Clustal W alignment of Human and Danio rerio Kif6 protein to highlight the P293T mutation (marked by asterisk). (B) Schematic of changes for donor editing of the kif6dp20 allele. (C) Sanger sequence of a stable heterozygous kif6dp20 mutant zebrafish. (D) Representative EcoR1 and allele specific genotyping of the kif6dp20 allele. (E, F) Representative phenotypes of a homozygous kif6dp20 mutant zebrafish at 30 dpf. PHENOTYPE:
|
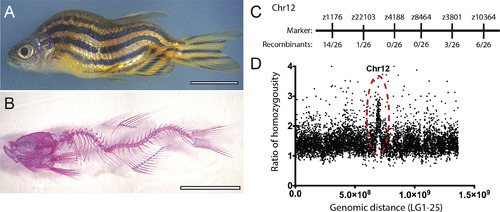
The falkor scoliosis mutant. (A) Bright field and (B) Alizarin-Red/Alcian-Blue stained skeletal preparations illustrate the homozygous falkor mutant phenotype. (C) Meiotic mapping places the mutation on Chr. 12 in the neighborhood of z4188 and z3801. (D) Mapping by regions of homozygosity suggests a causative mutation in korken gene on Chr. 12. PHENOTYPE:
|
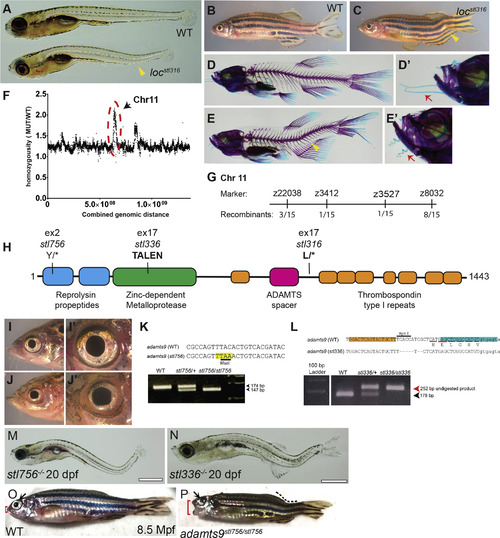
The pimienta locura/locstl97 mutation is predicted to generate a truncated Adamts9 protein. Bright field of representative sibling WT and mutant locstl316/stl316 phenotypes at 5 dpf (A) and 60 dpf (B, C) and Alizarin-Red and Alcian-Blue skeletal preparations of WT (D, D′) and locstl316/stl316 mutants (E, E′) highlighting the caudal-localized curvature of the notochord and spine (yellow arrowhead). Close-ups of zebrafish faces highlighting phenotypic differences in barbel morphology (red arrows) normally straight in the wild type (D′) and curly or kinky in locstl316/stl316 mutants (E′). Homozygosity based mapping graphed as mutant allele ratio over the total genomic distance shows a major peak of homozygosity at Chromosome 11 and a minor peak at Chromosome 15 (F). The locstl316 lesion was mapped to a region of Chromosome 11 between markers z3412 and z3527 (number of recombinants are denoted at each marker) representing a large ~26 Mb region annotated for 519 genes in the Zv10 build. A schematic of the predicted 1443-amino acid protein, showing the locations of three novel adamts9 mutant alleles in this study (H). (I-J′) Close-ups brightfield imaging of head and eye to highlight the alteration in eye morphology observed in a representative adamts9stl316/stl316 mutant (J, J′) and wild-type (I, I′). (M–P) Bright field imaging shows severe curvatures of the spine and eye defects are observed by 20 dpf for both (M) adamts9stl756 and (N) adamts9stl336. (P) While most of these mutants are larval lethal rare escapers can survive to adulthood but display severe defects in eye development (black arrow), spine curvature (dotted line), and defects of the jaw (red bracket), (O) not observed in WT siblings. PHENOTYPE:
|
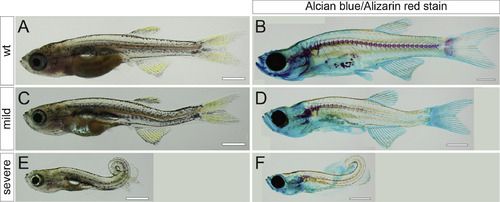
Transheterozygous adamts9stl756/stl316 mutants display severe body curvature phenotypes. (A, C, E) Bright field and (B, D, F) Alizarin-Red and Alcian-Blue stained skeletal preparations illustrate representative phenotypes from an adamts9stl756/+ x adamts9stl316/+ intercross. (A, B) wild type, (C, D) mild, and (E, F) severe phenotypes. PHENOTYPE:
|
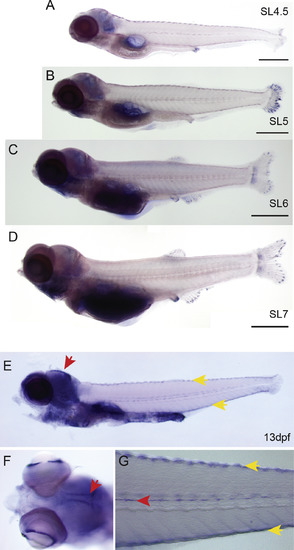
In situ hybridization of adamts9 (A–D) Lightly-stained staged series from WT fish showing adamts9 expression in the head, cloaca, and at the tips of growing fins rays. (E–G) Extended staining at 13 dpf highlights specific adamts9 expression in the head in bilateral strips in the brain (red arrows; E, F), staining of the melanocytes (yellow arrows), in the ciliated marginal zone of the eyes (F) and in the lateral line (G). |
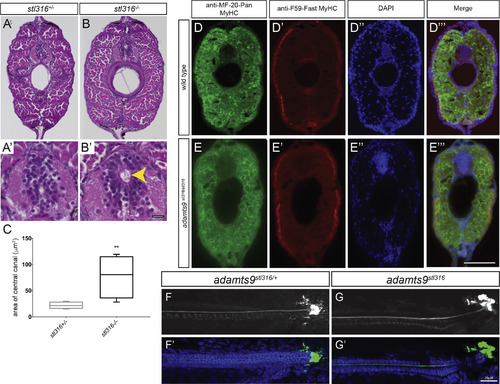
Assessment of adult adamts9stl316/stl316 mutants reveals a consistent expansion of the central canal, without alteration of musculature (A-B′) Bright field of H&E stained transverse sections from heterozygous (A, A′) and adamts9stl316/stl316 mutants (B, B′) at 90 dpf. (C) Graph of central canal area as box plot with SD and mean demonstrating a significant (p > 0.01) increase in the central canal area in homozygous adamts9stl316 mutants (yellow arrow) compared to heterozygous carriers. Fluorescent immunohistochemistry of transverse sections from WT (D-D‴) and adamts9stl316/stl316 mutant (E-E‴) demonstrating no obvious changes in musculature in Pan-Myosin Heavy Chain expression (D, E) or in Fast twitch Myosin Heavy Chain expression (D′, E′) in the trunk musculature. Nuclei are counterstained by DAPI (D″, E″). Confocal images of AFRU stained Reissner fiber (F, G) and merged images with DAPI-stained nuclei (F′, G′) in adamts9stl316/+ heterozygous (F, F′) and adamts9stl316/stl316 mutants (G, G′) at 15 dpf, which shows no obvious defects in Reissner fiber assembly. Scale bars are 10 μM in A′, B′ and 20 μM in D-G’. PHENOTYPE:
|

ZFIN is incorporating published figure images and captions as part of an ongoing project. Figures from some publications have not yet been curated, or are not available for display because of copyright restrictions. PHENOTYPE:
|
Reprinted from Developmental Biology, 471, Gray, R.S., Gonzalez, R., Ackerman, S.D., Minowa, R., Griest, J.F., Bayrak, M.N., Troutwine, B., Canter, S., Monk, K.R., Sepich, D.S., Solnica-Krezel, L., Postembryonic screen for mutations affecting spine development in zebrafish, 18-33, Copyright (2020) with permission from Elsevier. Full text @ Dev. Biol.