
- Title
-
Notch Signaling Controls Oligodendrocyte Regeneration in the Injured Telencephalon of Adult Zebrafish
- Authors
- Kim, H.K., Lee, D.W., Kim, E., Jeong, I., Kim, S., Kim, B.J., Park, H.C.
- Source
- Full text @ Exp. Neurobiol.
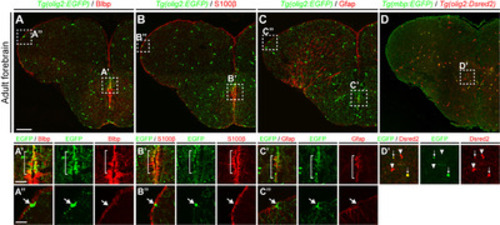
Fig. 1. olig2+ RG in the telencephalic ventricular zone of adult zebrafish. All panels show transverse sections of the telencephalon of adult zebrafish, with the dorsal side at the top. (A~C) Labeling of Tg(olig2:EGFP) zebrafish with various RG markers: anti-BLBP, -S100β, and -GFAP antibodies. Boxed areas indicate the MVZ (A’~C’) and LVZ (A”~C”) of the telencephalon. The bracketed area in (A’~C’) indicates the MVZ in which olig2+ RG exist. (A”~C”) arrows indicate olig2+ non-RGs in the LVZ. Seven zebrafish brains were analyzed in each indicated group and representative images were presented. (D~D’) Identification of mature oligodendrocytes in the telencephalic parenchymal region of the adult Tg(olig2:Dsred2)/Tg(mbp:EGFP) zebrafish. The boxed area in (D’) indicates the parenchymal region showing oligodendrocyte lineage cells. Arrows indicate mbp:EGFP+/olig2:Dsred+ mature oligodendrocytes, and arrowheads indicate mbp:EGFP-/olig2:Dsred+ OPCs (n=8 sections from one zebrafish). Scale bars: A~D, 100 μm; A’~C”, 25 μm. GFAP, glial fibrillary acidic protein; EGFP, enhanced green fluorescent protein; LVZ, lateral ventricular zone; MVZ, medial ventricular zone; OPCs, oligodendrocyte progenitor cells; RG, radial glia. |
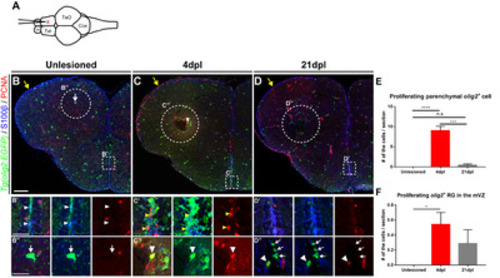
Fig. 2. Proliferation of Olig2+ RG and parenchymal OPCs is increased in the injured hemisphere of the adult telencephalon. All panels show transverse sections of the telencephalon, with the dorsal side at the top. (A) Scheme depicting the stab wound paradigm in the adult zebrafish telencephalon. (B~D) Labeling of adult Tg(olig2:EGFP) zebrafish with a proliferation marker (PCNA) and RG marker (S100β) in the uninjured controls (B), 4 days post-lesion (dpl) (C), and 21 dpl (D). Yellow arrows indicate the LVZ area of the injured hemisphere of the telencephalon. (B’~D’) The MVZ of the normal (B’) and injured hemisphere (C’, D’) of the telencephalon. White arrowheads indicate olig2:EGFP+/PCNA- non-proliferating RG (B’) and yellow arrowheads indicate olig2:EGFP+/PCNA+ proliferating RG (C’). (B”~C’’) The parenchymal area of the wildtype (B”) and injured hemispheres (C”, D”) of the telencephalon. Arrows indicate non-proliferating OPCs (B”, D”) and arrowheads indicate proliferating OPCs (C”, D”) in the parenchyma. (E) Quantification of S100β-/EGFP+/PCNA+ proliferating OPCs in the parenchymal area of the telencephalon (n=8 sections from three zebrafish, Kruskal–Wallis test, Post-hoc Dunn’s multiple comparisons: ***p<0.001 and ****p<0.0001). (F) Quantification of proliferating olig2+ RG (S100β+/EGFP+/PCNA+) in the MZ (n=8 sections from three zebrafish, Kruskal–Wallis test, Post-hoc Dunn’s multiple comparisons: *p<0.05). Scale bars: B~D, 100 μm; B’~D”, 25 μm. EGFP, enhanced green fluorescent protein; LVZ, lateral ventricular zone; MVZ, medial ventricular zone; OPCs, oligodendrocyte progenitor cells; PCNA, proliferating cell nuclear antigen; RG, radial glia. |
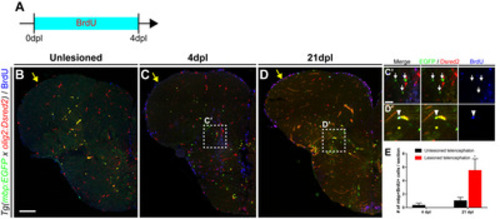
Fig. 3. Regeneration of mature oligodendrocytes in the injured telencephalon. All panels show transverse sections of the telencephalon of adult zebrafish, with the dorsal side at the top. (A) Scheme of BrdU treatment. (B~D) Labeling of the telencephalon of Tg(mbp:EGFP) adult zebrafish with anti-BrdU antibody. Yellow arrows indicate the LVZ area of the control (B) and injured hemispheres of the telencephalon (C, D). (C’, D’) Boxed areas in C and D indicate the parenchymal area near the injury site. Arrows indicate mbp:EGFP+/BrdU- pre-existing mature oligodendrocytes (C’), and arrowheads indicate mbp:EGFP+/BrdU+ newly generated mature oligodendrocytes (D’). (E) Quantification of newly generated EGFP+/Dsred2+/BrdU+ mature oligodendrocytes (n=7 sections from two zebrafish, Mann–Whitney U test, *p<0.05). Scale bars: B~D, 100 μm; C’~D’, 25 μm. BrdU, bromodeoxyuridine; EGFP, enhanced green fluorescent protein; LVZ, lateral ventricular zone. |
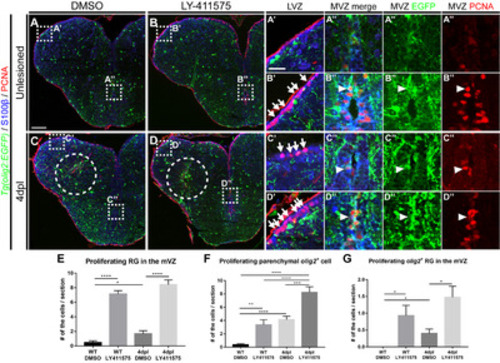
Fig. 4. Notch signaling is involved in the proliferation of olig2+ RG and parenchymal OPCs. All panels show transverse sections of the telencephalon, with the dorsal side at the top. (A~D”) Labeling of the telencephalon of Tg(olig2:EGFP) adult zebrafish with anti-S100β and -PCNA antibodies. (A, B) Treatment of wildtypes with DMSO (A) and LY-411575 to inhibit Notch signaling (B). Boxed areas indicate the LVZ (A’, B’) and MVZ (A”, B”). Arrows indicate PCNA+/S100β+ proliferating RG (B’), and the arrowhead indicates PCNA+/S100β+/olig2:EGFP+ proliferating RGs (B”). (C, D) Treatment of the injured telencephalon 4 dpl with DMSO (C) and LY-411575 to inhibit Notch signaling (D). Arrows indicate PCNA+/S100β+ proliferating RGs (C’, D’), and arrowheads indicate PCNA+/S100β+/olig2:EGFP+ proliferating RGs (C”, D”). (E~G) Quantification of proliferating RGs (S100β+/EGFP+/PCNA+) in the medial ventricular zone (E), proliferating parenchymal OPCs (S100β-/EGFP+/PCNA+) (F), and proliferating olig2+ RGs (S100β+/EGFP+/PCNA+) in the medial ventricular zone (G) (n=9 sections from two zebrafish, Mann–Whitney U test, *p<0.05, **p<0.01, ***p<0.001 and ****p<0.0001). Scale bars: A~D, 100 μm; A’~D”, 25 μm. DMSO, dimethyl sulfoxide; EGFP, enhanced green fluorescent protein; LVZ, lateral ventricular zone; MVZ, medial ventricular zone; OPCs, oligodendrocyte progenitor cells; PCNA, proliferating cell nuclear antigen; RG, radial glia. |