
- Title
-
PHF6 Expression Levels Impact Human Hematopoietic Stem Cell Differentiation
- Authors
- Loontiens, S., Dolens, A.C., Strubbe, S., Van de Walle, I., Moore, F.E., Depestel, L., Vanhauwaert, S., Matthijssens, F., Langenau, D.M., Speleman, F., Van Vlierberghe, P., Durinck, K., Taghon, T.
- Source
- Full text @ Front Cell Dev Biol
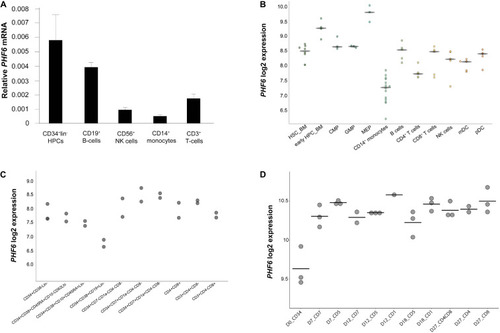
Dynamic PHF6 expression during human hematopoiesis. Relative expression of PHF6 in various hematopoietic cell types: (A) in sorted subsets of human hematopoietic cell lineages, data shows the average of 3–4 independent samples and error bars indicate SEM; (B) adapted from Bloodspot (bloodspot.eu); (C) during human lymphopoiesis (Casero et al., 2015) or (D) during early T lymphoid development in vitro (Canté-Barrett et al., 2017). |
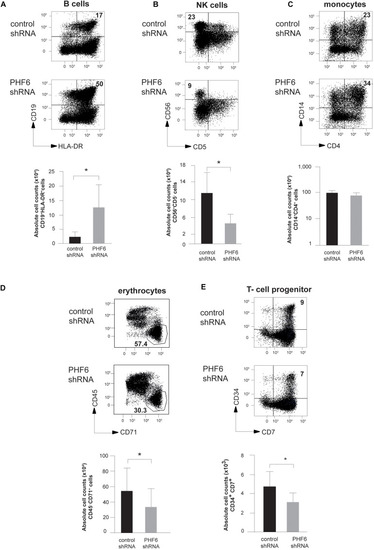
PHF6 is essential for normal hematopoietic differentiation. (A–D) (up) Dot plots show flow cytometry analysis of control and PHF6 shRNA transduced cord blood CD34+Lin– precursors in OP9-GFP cocultures, showing the development of (A) CD19+HLA-DR+ B-lineage cells after 28 days of coculture, (B) CD56 + CD5- NK cells after 21 days of coculture, (C) CD14+ CD4+ monocytes after 14 days of coculture and (D) CD45+ CD71– erythrocytes after 7 days of coculture. Bar plots (down) show absolute numbers of corresponding populations. (E) (up) Dot plots show flow cytometry analysis of control and PHF6 shRNA transduced cord blood CD34+Lin– precursors in OP9-DLL1 cocultures, showing the development of CD34+CD7+ T cell precursors after 7 days of coculture. Bar plot (down) shows absolute numbers of the corresponding population. Data shows average of 5–7 independent experiments and error bars indicate SEM. *P < 0.05 (non-parametric paired Wilcoxon test). |
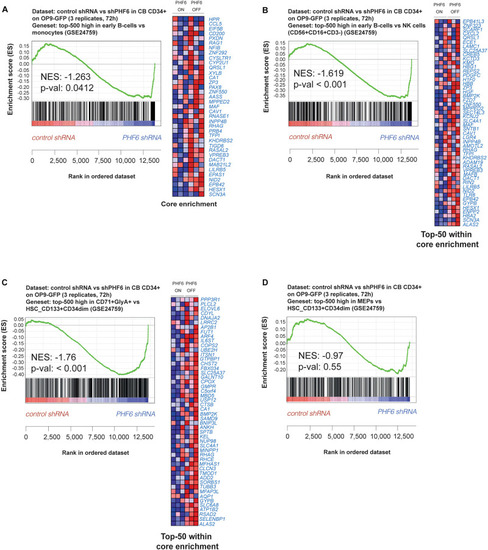
PHF6 controls the expression of hematopoietic lineage genes. (A,B) Gene Set Enrichment Analysis shows that an early B cell gene signature is significantly enriched at expense of (A) a myeloid gene signature (GSE24759) and (B) NK cell (CD56+CD16+CD3–) gene signature (GSE24759) in short-term cultures of CD34+ progenitors on an OP9-GFP stromal feeder layer with stable PHF6 knockdown (GSE85373). (C,D) Gene Set Enrichment Analysis shows that an erythrocyte gene signature (C) but not a MEP gene signature (D) is significantly enriched at expense of a HSCs gene signature (GSE24759) in short-term cultures of CD34+ progenitors on an OP9-GFP stromal feeder layer with stable PHF6 knockdown. |
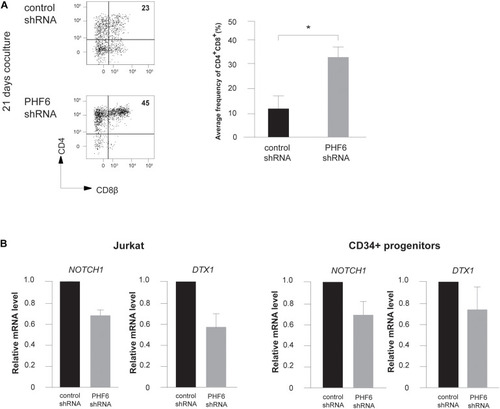
PHF6 modulates Notch1 expression and its downstream signaling activity. (A) (left) Flow cytometry analysis of control and PHF6 shRNA transduced CD34+ thymocytes in OP9-DLL1 cocultures in the presence of IL7, SCF and FLT3L, showing the development of CD4+CD8β+ DP thymocytes after 21 days of coculture. (right) Bar plot showing the frequency of CD4+CD8β+ DP thymocytes, generated in the corresponding cultures. Data shows the average of 4 independent experiments and errors bars show SEM. *P < 0.05 (paired t-test) (B) Normalized NOTCH1 and DTX1 expression in Jurkat cells (left) and CB-derived CD34+ HPCs (right) following control or PHF6 shRNA transduction as indicated. Data shows the average expression in 3 independent samples and error bars indicate SEM. |
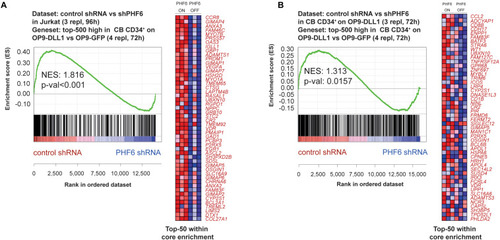
PHF6 modulates the Notch1 gene signature. Gene Set Enrichment Analysis shows that the top-500 significantly induced genes in CB CD34+ progenitors cultured on an OP9-DLL1 stromal feeder layer in comparison to OP9-GFP cocultures are significantly enriched in the set of genes that are downregulated upon stable knockdown of PHF6 in panel (A) Jurkat T-ALL cells (GSE85373) and (B) CB CD34+ cells cultured on an OP9-DLL1 stromal feeder layer (GSE85373). |
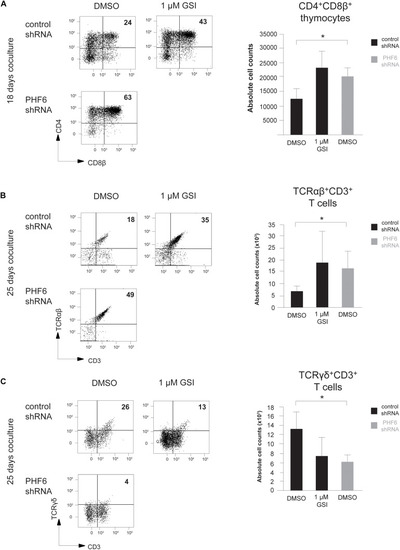
Loss of PHF6 mimics reduced Notch activity during human T cell development. (A–C) (left) Flow cytometry analysis and (right) absolute cell counts of control versus PHF6 shRNA transduced or DMSO versus 1 μM GSI treated CD34+ thymocytes in OP9-DLL1 cocultures showing (A) the development of CD4+CD8β+ DP thymocytes after 18 days of coculture, (B) the development of CD3+TCRαβ+ thymocytes after 25 days of coculture and (C) the development of CD3+TCRγδ+ thymocytes after 25 days of coculture. Data shows the average of 3 independent experiments and errors bars show SEM. *P < 0.05 (paired t-test). |
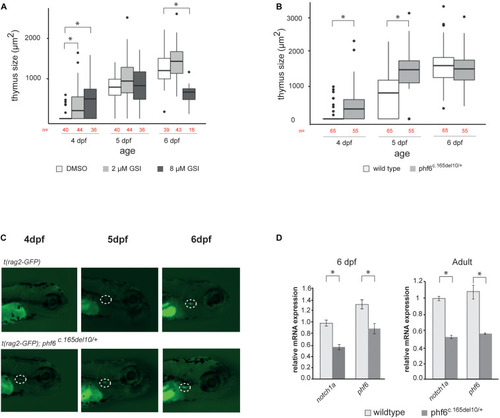
phf6 downregulation accelerates T cell development in vivo. (A) Box plot showing thymus size (μm2) at 4, 5, and 6 days post-fertilization (dpf) based on GFP signal of wild type (AB) fish treated with 2 or 8 μM of gamma-secretase inhibitor (GSI) or DSMO as control treatment. Details on these results are provided in Supplementary Table 2 and statistical analysis is shown in Supplementary Table 3, ∗P < 0.05 (Wilcoxon rank sum test). (B) Boxplot showing thymus size (μm2) of wild type (AB) and phf6c.165del10/+ heterozygous embryos from 4 until 6 dpf based on rag2-GFP signal quantification. ∗P < 0.05 (Wilcoxon rank sum test, Supplementary Table 4). (C) Representative image of thymus visualization used for quantification of data as shown in panel (A). Original magnification X30. Circle with white dashed line indicates emerging thymus. (D) Average normalized notch1a and phf6 expression in sorted T cells of 4 replicates of 100 pooled wild type (AB) and phf6c.165del10/ + embryo’s on 6dp (left) and of 3 replicates of 6 pooled wildtype and 6 pooled phf6c.165del10/ + adult zebrafish (right). Error bars indicate SEM, ∗P < 0.05 (unpaired T-test). |

ZFIN is incorporating published figure images and captions as part of an ongoing project. Figures from some publications have not yet been curated, or are not available for display because of copyright restrictions. |