
Image
|
Figure Caption
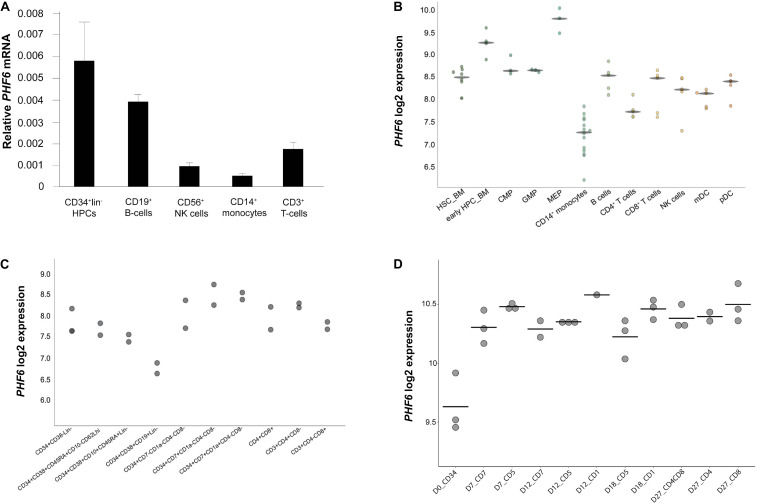
Fig. 1
Dynamic PHF6 expression during human hematopoiesis. Relative expression of PHF6 in various hematopoietic cell types: (A) in sorted subsets of human hematopoietic cell lineages, data shows the average of 3–4 independent samples and error bars indicate SEM; (B) adapted from Bloodspot (bloodspot.eu); (C) during human lymphopoiesis (Casero et al., 2015) or (D) during early T lymphoid development in vitro (Canté-Barrett et al., 2017).
Acknowledgments
This image is the copyrighted work of the attributed author or publisher, and
ZFIN has permission only to display this image to its users.
Additional permissions should be obtained from the applicable author or publisher of the image.
Full text @ Front Cell Dev Biol