
FIGURE
Fig. 6
- ID
- ZDB-FIG-201202-12
- Publication
- Loontiens et al., 2020 - PHF6 Expression Levels Impact Human Hematopoietic Stem Cell Differentiation
- Other Figures
- All Figure Page
- Back to All Figure Page
Fig. 6
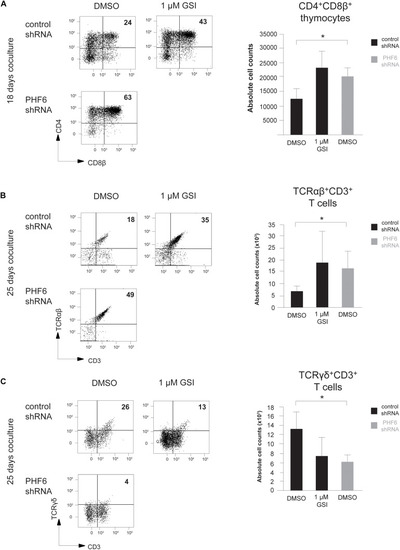
Loss of PHF6 mimics reduced Notch activity during human T cell development. (A–C) (left) Flow cytometry analysis and (right) absolute cell counts of control versus PHF6 shRNA transduced or DMSO versus 1 μM GSI treated CD34+ thymocytes in OP9-DLL1 cocultures showing (A) the development of CD4+CD8β+ DP thymocytes after 18 days of coculture, (B) the development of CD3+TCRαβ+ thymocytes after 25 days of coculture and (C) the development of CD3+TCRγδ+ thymocytes after 25 days of coculture. Data shows the average of 3 independent experiments and errors bars show SEM. *P < 0.05 (paired t-test). |
Expression Data
Expression Detail
Antibody Labeling
Phenotype Data
Phenotype Detail
Acknowledgments
This image is the copyrighted work of the attributed author or publisher, and
ZFIN has permission only to display this image to its users.
Additional permissions should be obtained from the applicable author or publisher of the image.
Full text @ Front Cell Dev Biol