FIGURE SUMMARY
Title

HDAC8: A Promising Therapeutic Target for Acute Myeloid Leukemia

Authors
Spreafico, M., Gruszka, A.M., Valli, D., Mazzola, M., Deflorian, G., Quintè, A., Totaro, M.G., Battaglia, C., Alcalay, M., Marozzi, A., Pistocchi, A.
Source
Full text @ Front Cell Dev Biol

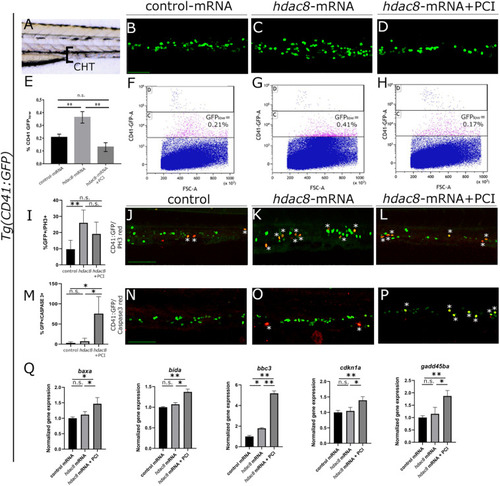
Analysis of Hdac8 overexpression in zebrafish and apoptosis induced by PCI treatment. (A) Scheme of trunk-tail region of zebrafish embryos: confocal imaging was always performed on the same embryo region, comprising the tip of the yolk sack extension, between the dorsal aorta and the vein; representative images of (B) control; (C)hdac8-mRNA injected; (D) PCI-treated hdac8-mRNA injected Tg(CD41:GFP) zebrafish embryos at 3 dpf. Scale bar represents 100 μm. (E) Quantification by FACS of GFPlow-HSPCs of (F) control; (G)hdac8-mRNA injected; (H) PCI-treated hdac8-mRNA injected Tg(CD41:GFP) zebrafish embryos at 3 dpf. The results are presented as mean ± SD from three independent experiments. (I–L) Proliferation of HSPCs in the caudal hematopoietic tissue of the Tg(CD41:GFP) zebrafish line following Hdac8 overexpression and PCI treatment. GFP+ HSPCs in green; PH3 in red; quantification in (I), N = 6 embryos analyzed. (M–P) Apoptosis of HSPCs in the caudal hematopoietic tissue of the Tg(CD41:GFP) zebrafish line following PCI treatment. GFP+ HSPCs in green; activated caspase-3+ cells in red; quantification in (M), N = 3 embryos analyzed. Asterisks indicate double positive cells (yellow). Scale bar represents 100 μm. (Q) RT-qPCR analyses of apoptotic markers baxa, bida, bbc3, cdkn1a, and gadd45ba expression in control mRNA and hdac8-overexpressing zebrafish embryos treated with DMSO or PCI. The results are presented as mean value ± SD from three independent experiments. *p < 0.05, **p < 0.01, n.s. = not significant, one-way ANOVA followed by Tukey post hoc correction.

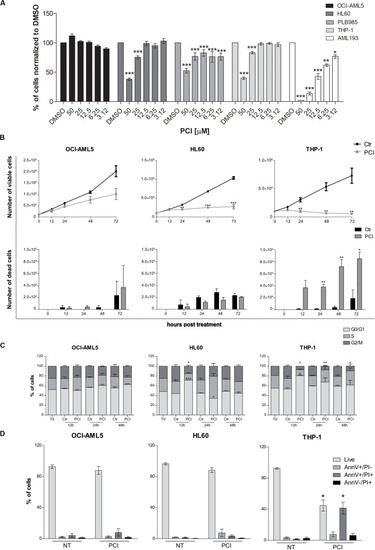
Cytostatic and cytotoxic effect of PCI in AML cell lines. (A) The indicated cell lines were treated for 72 h with different concentration of PCI, or DMSO alone as a control. CTG assay was used to assess the effect of the treatment on the cell viability. The results are presented as mean ± SD from four technical replicates deriving from one independent experiment for PLB985 and AML193 cell lines, and at least two independent experiments for OCI-AML5, HL60, and THP-1 cell lines. (B) Effect of PCI on AML cell line growth. Cells were treated with 50 μM of PCI or with DMSO as a control. Cell viability (upper panel) and cell death (lower panel) were determined 12, 24, 48, and 72 h after treatment using trypan blue staining. The results are presented as mean ± SEM from two independent experiments for 12 h and three independent experiments for the others time points. (C) Cell cycle time course over 48 h of PCI treatment. Cells were treated with 50 μM of PCI or with DMSO as a control. Histogram showing cell distribution in three different cell cycle phases indicated as diverse shades of gray. The results are presented as mean ± SEM from two independent experiments. (D) Induction of apoptosis upon 72 h of PCI treatment. Cells were treated with 50 μM of PCI or with DMSO as a control. Histogram showing the percentage of live, AnnV+/PI, AnnV+/PI+ and AnnV–/PI+ cells indicated as diverse shades of gray. The results are presented as mean ± SEM from three independent experiments. NT, untreated; T0, time zero; AnnV, annexin V; PI, propidium iodide. *p < 0.05, **p < 0.01, ***p < 0.001, Student’s t-test.

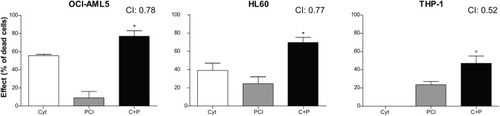
Combination treatment with cytarabine + PCI. OCI-AML5, HL60, and THP-1 cell lines were treated for 72 h with single compound and their combination. CTG assay was used to assess the effect of each treatment on the cell culture viability. The bar graph represents the effect of one of the eight concentrations tested. CI values are shown for each combination. The results are presented as mean ± SEM from two independent experiments. Asterisk (*) indicates significance of combination treatment versus PCI, circle (°) indicates significance of combination treatment versus cytarabine. One symbol, p < 0.05, Student’s t-test. Cyt and C, cytarabine; P, PCI; CI, combination index.

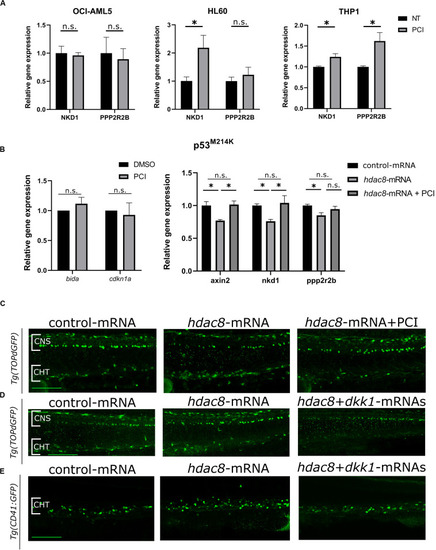
Canonical Wnt pathway modulation by HDAC8. (A) Canonical Wnt pathway modulation by PCI in OCI-AML5, HL60, and THP-1 cell lines. NKD1 and PPP2R2B Wnt inhibitors were analyzed by RT-qPCR. Results are presented as mean ± SD from three independent experiments. *p < 0.05, Student’s t-test. (B) WNT pathway modulation by PCI in zebrafish mutant p53M214K. bida and cdkn1a apoptotic genes and axin2, nkd1 and pppr2r2b WNT target genes were analyzed by RT-qPCR. Results are presented as mean ± SD from three independent experiments. n.s.: not significant, *p < 0.05; One sample t-test for apoptotic genes, one-way ANOVA followed by Tukey post hoc correction for canonical WNT pathway genes. (C) Representative images of canonical Wnt modulation by hdac8 overexpression and PCI on HSPCs in the CHT of the Wnt reporter line Tg(TOPdGFP). (D,E) Representative images of canonical Wnt modulation by hdac8 overexpression and Wnt inhibition by dkk1b injection on HSPCs in the CHT of the Wnt reporter line Tg(TOPdGFP) and of the HSPCs reporter line Tg(CD41:GFP). NT, not treated; CNS, central nervous system; CHT, caudal hematopoietic tissue. Scale bar represents 100 μm.

ZFIN is incorporating published figure images and captions as part of an ongoing project. Figures from some publications have not yet been curated, or are not available for display because of copyright restrictions.

EXPRESSION / LABELING:
Gene:
Antibodies:
Fish:
Anatomical Term:
Stage: Long-pec
Acknowledgments
This image is the copyrighted work of the attributed author or publisher, and ZFIN has permission only to display this image to its users. Additional permissions should be obtained from the applicable author or publisher of the image. Full text @ Front Cell Dev Biol