
|
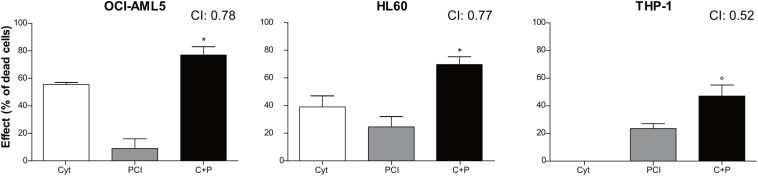
Fig. 3
Combination treatment with cytarabine + PCI. OCI-AML5, HL60, and THP-1 cell lines were treated for 72 h with single compound and their combination. CTG assay was used to assess the effect of each treatment on the cell culture viability. The bar graph represents the effect of one of the eight concentrations tested. CI values are shown for each combination. The results are presented as mean ± SEM from two independent experiments. Asterisk (*) indicates significance of combination treatment versus PCI, circle (°) indicates significance of combination treatment versus cytarabine. One symbol,