IMAGE

Fig. 4

ID
ZDB-IMAGE-201007-24
Source
Figures for Spreafico et al., 2020
Image
Figure Caption

Fig. 4

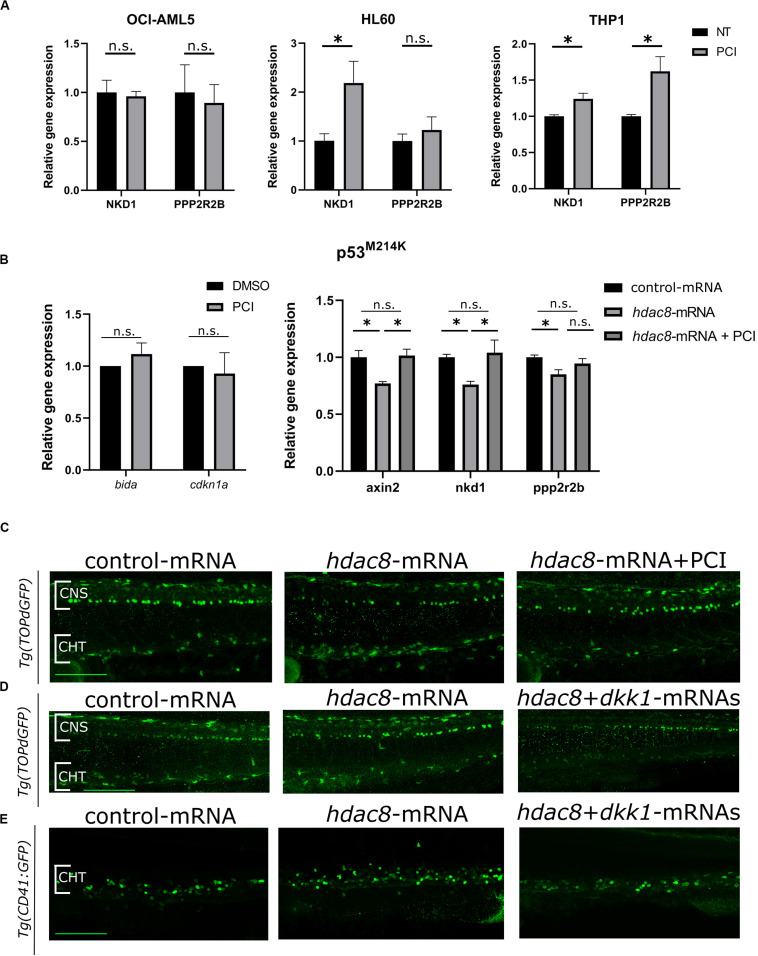
Canonical Wnt pathway modulation by HDAC8. (A) Canonical Wnt pathway modulation by PCI in OCI-AML5, HL60, and THP-1 cell lines. NKD1 and PPP2R2B Wnt inhibitors were analyzed by RT-qPCR. Results are presented as mean ± SD from three independent experiments. *p < 0.05, Student’s t-test. (B) WNT pathway modulation by PCI in zebrafish mutant p53M214K. bida and cdkn1a apoptotic genes and axin2, nkd1 and pppr2r2b WNT target genes were analyzed by RT-qPCR. Results are presented as mean ± SD from three independent experiments. n.s.: not significant, *p < 0.05; One sample t-test for apoptotic genes, one-way ANOVA followed by Tukey post hoc correction for canonical WNT pathway genes. (C) Representative images of canonical Wnt modulation by hdac8 overexpression and PCI on HSPCs in the CHT of the Wnt reporter line Tg(TOPdGFP). (D,E) Representative images of canonical Wnt modulation by hdac8 overexpression and Wnt inhibition by dkk1b injection on HSPCs in the CHT of the Wnt reporter line Tg(TOPdGFP) and of the HSPCs reporter line Tg(CD41:GFP). NT, not treated; CNS, central nervous system; CHT, caudal hematopoietic tissue. Scale bar represents 100 μm.

Acknowledgments
This image is the copyrighted work of the attributed author or publisher, and ZFIN has permission only to display this image to its users. Additional permissions should be obtained from the applicable author or publisher of the image. Full text @ Front Cell Dev Biol