IMAGE

Fig. 2

ID
ZDB-IMAGE-201007-22
Source
Figures for Spreafico et al., 2020
Image
Figure Caption

Fig. 2

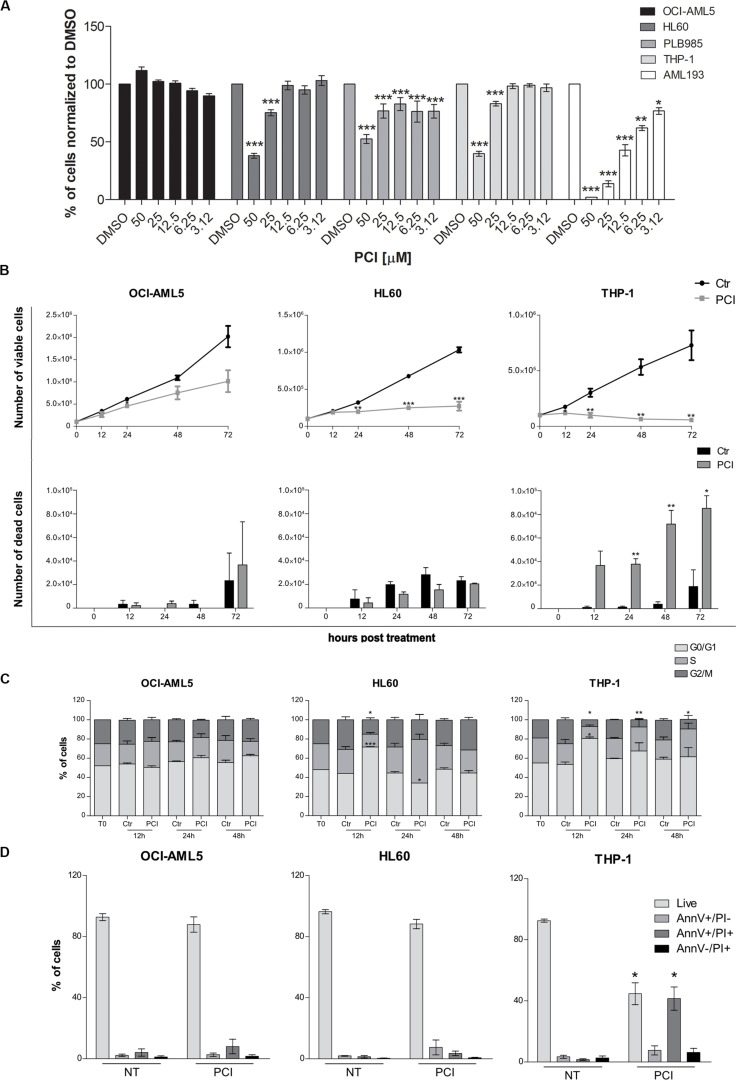
Cytostatic and cytotoxic effect of PCI in AML cell lines. (A) The indicated cell lines were treated for 72 h with different concentration of PCI, or DMSO alone as a control. CTG assay was used to assess the effect of the treatment on the cell viability. The results are presented as mean ± SD from four technical replicates deriving from one independent experiment for PLB985 and AML193 cell lines, and at least two independent experiments for OCI-AML5, HL60, and THP-1 cell lines. (B) Effect of PCI on AML cell line growth. Cells were treated with 50 μM of PCI or with DMSO as a control. Cell viability (upper panel) and cell death (lower panel) were determined 12, 24, 48, and 72 h after treatment using trypan blue staining. The results are presented as mean ± SEM from two independent experiments for 12 h and three independent experiments for the others time points. (C) Cell cycle time course over 48 h of PCI treatment. Cells were treated with 50 μM of PCI or with DMSO as a control. Histogram showing cell distribution in three different cell cycle phases indicated as diverse shades of gray. The results are presented as mean ± SEM from two independent experiments. (D) Induction of apoptosis upon 72 h of PCI treatment. Cells were treated with 50 μM of PCI or with DMSO as a control. Histogram showing the percentage of live, AnnV+/PI, AnnV+/PI+ and AnnV–/PI+ cells indicated as diverse shades of gray. The results are presented as mean ± SEM from three independent experiments. NT, untreated; T0, time zero; AnnV, annexin V; PI, propidium iodide. *p < 0.05, **p < 0.01, ***p < 0.001, Student’s t-test.

Acknowledgments
This image is the copyrighted work of the attributed author or publisher, and ZFIN has permission only to display this image to its users. Additional permissions should be obtained from the applicable author or publisher of the image. Full text @ Front Cell Dev Biol