
- Title
-
Ets1 functions partially redundantly with Etv2 to promote embryonic vasculogenesis and angiogenesis in zebrafish
- Authors
- Chetty, S.C., Sumanas, S.
- Source
- Full text @ Dev. Biol.
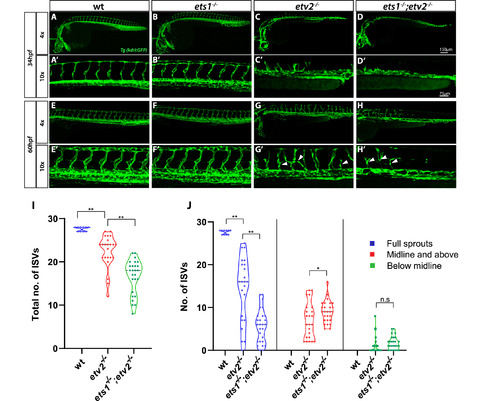
Loss of Ets1 function exacerbates vascular defects in etv2−/−embryos. (A-H′) Confocal images of Tg(kdrl:GFP) expression in wt, ets1−/−, etv2−/−and ets1−/−; etv2−/−embryos at 34 hpf and 60 hpf using 4× and 10× objectives. ets1−/−embryos display normal vascular patterning (B-B′, F-F′), similar to wild type embryos (A-A′,E-E′). ISVs begin to emerge in etv2−/−embryos at ~34 hpf (C′) but are absent in ets1−/−; etv2−/− double mutant embryos (D′). At 60 hpf, ets1−/−; etv2−/−embryos have fewer ISVs and less recovery in axial vasculature than etv2−/− embryos (G-H′). (I–J) Quantitative analysis of total number of ISVs and ISV height at 60 hpf. Note the reduction in number of ISVs (I) and full sprouts (J) in ets1−/−; etv2−/−compared to etv2−/−embryos. ∗P < 0.05, ∗∗P < 0.01; n.s – not significant. Horizontal bars within violin plots represent median. Arrowheads indicate mis-patterned and stunted ISVs. |

Overexpression of a constitutively active MAP2K1 construct compensates for a reduction in kdrl and kdr expression and partially rescues angiogenic defects in ets1−/−; etv2 MO embryos. (A) qPCR analysis of endothelial genes cdh5, kdrl and kdr in whole embryos at 32 hpf. Note the reduction in kdrl and kdr expression in ets1−/−; etv2−/−embryos compared to etv2−/−embryos (B-F″) Confocal images of 28 hpf Tg(kdrl:GFP) wildtype, ets1−/−, etv2 MO (0.25 ng), ets1−/−; etv2 MO (0.25 ng) and ets1−/−; etv2 MO; fli1aep:mCh-actMAP2K1 embryos. Note the mild angiogenic defects in etv2 MO (0.25 ng) embryos (D) and more severe defects in ets1−/−; etv2 MO embryos(E). (F-F″) Split images showing vascular GFP expression (F), mCherry expression from the actMAP2K1 construct (F′) and a merged image with GFP and mCherry (F″). (G) Quantification of ISVs in embryos from B-F. Note the increase in the number of ISVs in ets1−/−; etv2 MO; fli1aep:mCh-actMAP2K1 embryos compared to the ets1−/−; etv2 MO embryos. ∗P < 0.05, ∗∗P < 0.01; n.s – not significant; columns and horizontal bars in dotplots represent mean, error bars represent ± SEM. |
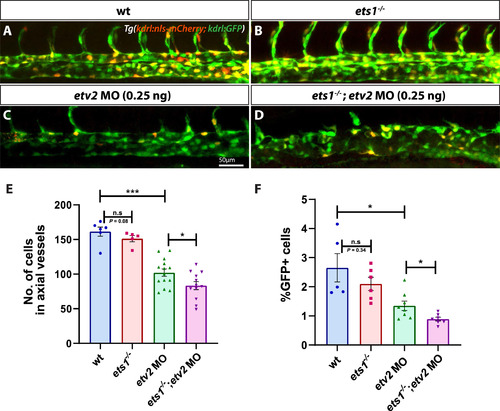
Loss of Ets1 function impairs vasculogenesis in Etv2-deficient embryos. (A–D) Confocal micrographs of 28 hpf Tg(kdrl:GFP; kdrl:nls-mCherry) wild-type, ets1−/−, etv2 MO (0.25 ng) and ets1−/−; etv2 MO (0.25 ng) zebrafish embryos (trunk region). (E) Quantitative analysis of endothelial cell number in the axial vessels of embryos in A-D by cell counts in Imaris. (F) FACS analysis of GFP + endothelial cells in 28 hpf embryos. Note the decrease in endothelial cell number between etv2 MO and ets1−/−; etv2 MO embryos (E,F). Lateral views; anterior is to the left. ∗P < 0.05, ∗∗∗P < 0.001; n.s – not significant; error bars represent ± SEM. |
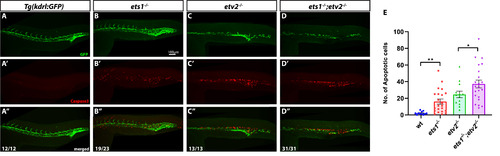
Ets1 promotes endothelial cell survival in axial vessels. (A-D″) Tg(kdrl:GFP), ets1−/−, etv2−/− and ets1−/−; etv2−/−embryos at 24 hpf immuno-stained for apoptosis marker Cleaved Caspase3 and vascular GFP. Note the normal vasculature in ets1−/−embryos (B) despite extensive Caspase 3 staining in the axial vessels (B′). Both etv2−/− (C-C″) and ets1−/−; etv2−/−embryos (D-D″) exhibit severe vascular defects and extensive apoptosis in the trunk region. (E) Quantification of apoptotic cells within trunk vasculature in 24 hpf embryos. Note the increase in apoptotic cells in the ets1−/−; etv2−/− embryos compared to etv2−/− embryos. ∗P < 0.05, ∗∗P < 0.01; horizontal bars represent mean, error bars represent ± SEM. |
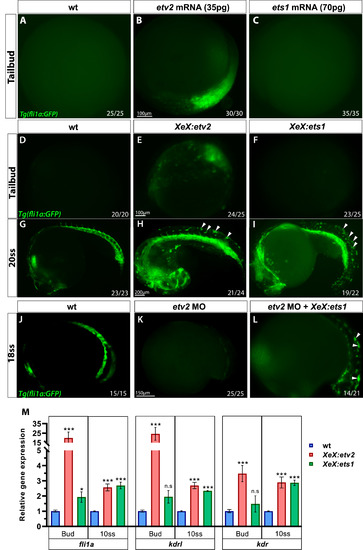
Ets1 exhibits delayed activity in inducing endothelial gene expression compared to Etv2. (A–C) Compound microscope images of GFP fluorescence in Tg(fli1a:GFP) wild-type, etv2 mRNA and ets1 mRNA-injected embryos at the tailbud (10 hpf) stage. Note the GFP fluorescence in etv2 mRNA-injected embryos (B) and the lack thereof in ets1 mRNA-injected embryos (C). (D–I) GFP fluorescence in Tg(fli1a:GFP) wild-type, XeX:etv2 and XeX:ets1-injected embryos at the tailbud and 20-somite stage (19 hpf). Note the absence of GFP fluorescence in XeX:ets1 embryos at the tailbud stage (F) but presence of ectopic GFP expression at 20-somite stage as indicated by white arrowheads (I). (J–L) GFP fluorescence in Tg(fli1a:GFP) wild-type, etv2 MO and etv2 MO; XeX:ets1 embryos at 18-somite stage (18 hpf). Note the GFP expression induced by XeX:ets1 even in the absence of Etv2 function (L). (M) qPCR of wildtype, XeX:etv2 and XeX:ets1 whole embryos at the tailbud and 10-somite stage. ∗P < 0.05, ∗∗P < 0.01 (P value was calculated between wt and injected embryos); n.s – not significant; error bars represent ± SEM. EXPRESSION / LABELING:
PHENOTYPE:
|
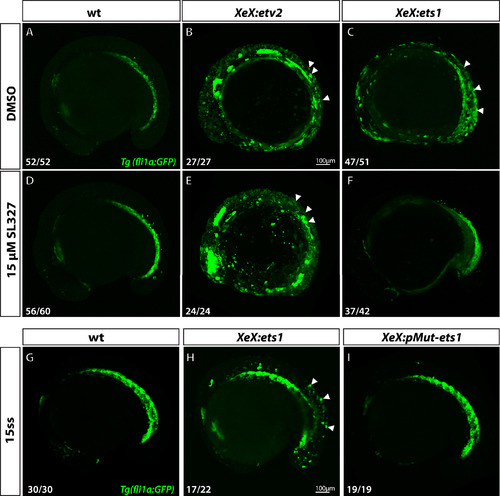
Ets1 activity depends on MAPK signaling and phosphorylation of conserved Thr30 and Ser33 residues. (A–F) Confocal micrographs of 12-somite stage Tg(fli1a:GFP) wild-type, XeX:etv2 and XeX:ets1-injected embryos treated with either DMSO (A–C) or 15 μM MAPK inhibitor SL327 (D–F) from 70% epiboly-12-somite stage. Note the absence of ectopic GFP fluorescence in XeX:ets1 embryos treated with SL327 (F) compared to those treated with DMSO (C). (G–I) Confocal micrographs of 15-somite stage Tg(fli1a:GFP) wild-type embryos, XeX:ets1 and XeX:pMut-ets1 (containing Thr30Ala and Ser33Ala mutations) embryos. Note the reduction of ectopic GFP expression in embryos injected with the XeX:pMut-ets1 construct containing mutated phosphorylation sites (I) compared to XeX:ets1-injected embryos (H). White arrowheads indicate ectopic GFP expression. |
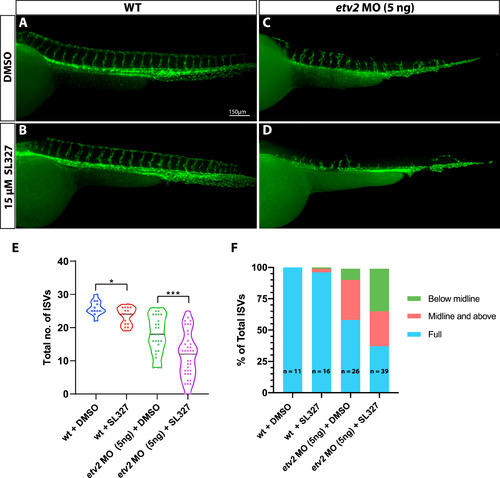
Inhibition of MAPK signaling during vasculogenesis exacerbates angiogenic defects in Etv2-deficient embryos. (A–D) Compound microscope images of 48 hpf Tg(kdrl:GFP) wild-type and etv2 MO (5 ng)-injected embryos treated either with DMSO or 15 μM MAPK inhibitor SL327. Note the severe ISV sprouting defects in etv2 MO + SL327 embryos (D) compared to etv2 MO + DMSO embryos (C). (E,F) Quantitative analysis of ISV number and height. Note the decrease in total number of ISVs (E) and percentage of full sprouts (F) in etv2 MO + SL327 embryos compared to etv2 MO + DMSO embryos. ∗P < 0.05, ∗∗∗P < 0.001. Horizontal bar within violin plots represents median. |
Reprinted from Developmental Biology, 465(1), Chetty, S.C., Sumanas, S., Ets1 functions partially redundantly with Etv2 to promote embryonic vasculogenesis and angiogenesis in zebrafish, 11-22, Copyright (2020) with permission from Elsevier. Full text @ Dev. Biol.