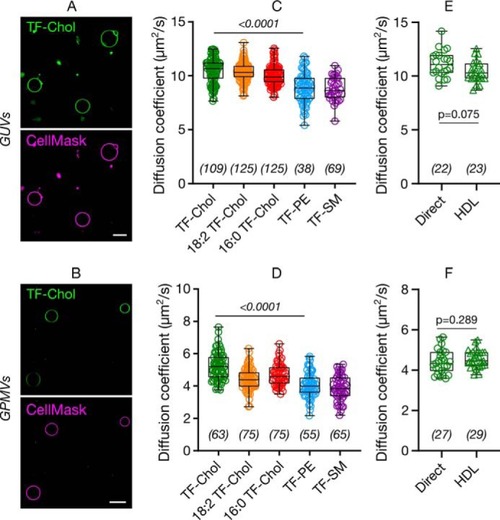
Diffusion of cholesterol compared with phospholipids in model membranes. Confocal images of (A) GUVs and (B) GPMVs labeled with TF-Chol (green) and CellMask (magenta), which labels the membrane. Scale bars are 10 μm. Diffusion of cholesterol and phospholipid analogues in (C) GUVs and (D) GPMVs. TF-Chol diffusion in (E) GUVs and (F) GPMVs with direct labeling or via HDL particles. Data are shown as box-and-whisker plot showing median, first and third quartiles, and all the data points. Number of data points are indicated on the graphs.
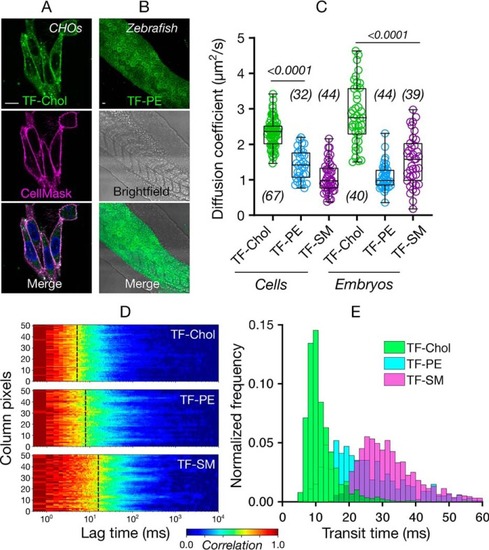
Diffusion of cholesterol compared with phospholipids in cellulo and in vivo. Confocal images of (A) CHO cells and (B) zebrafish embryos (24 h post fertilization) labeled with fluorescent lipid analogues (green) and Cell Mask Deep Red (magenta). Scale bars are 10 μm. C, diffusion coefficient of the fluorescent lipid analogues in CHO cells and zebrafish embryos. D, representative sFCS carpets for fluorescent lipid analogues in CHO cells. E, histogram of transit diffusion times of the fluorescent lipid analogues obtained from the sFCS data. Data are shown as box-and-whisker plot showing median, first and third quartiles, and maximum and minimum values. Number of data points are indicated on the graphs.
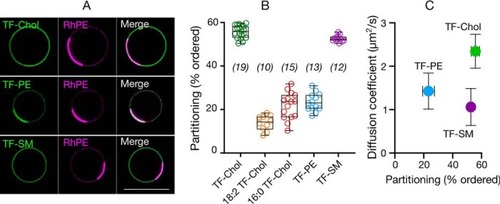
Relationship between diffusion in cells and analogue partitioning in phase-separated GPMVs.A, confocal images of TF-Chol, TF-PE, and TF-SM partitioning in phase separated GPMVs with rhodamine-PE (RhPE) as disordered phase marker. Scale bar is 10 μm. B, quantification of ordered domain partitioning of fluorescent lipid analogues from the confocal images. C, correlation between ordered domain partitioning in GPMVs and diffusion of fluorescent lipid analogues in cells. Data are shown as box-and-whisker plot showing median, first and third quartiles, and all the data values. Number of data points are indicated on the graphs.
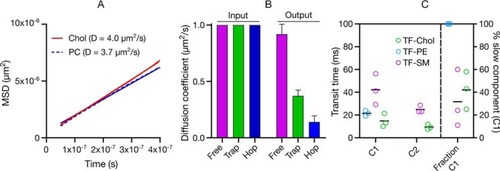
Diffusion mode of fluorescent lipid analogues.A, all-atom molecular dynamics simulation of cholesterol in liquid-disordered DPPC/DOPC/Chol membrane comparing cholesterol with phospholipid diffusion. B, Monte Carlo simulations of free, hop, and trapped diffusion probed by FCS showing how the hindrances affect the molecular diffusion. Input are the starting diffusion coefficients and Output are the diffusion coefficients when free diffusion or hindered diffusion (trapping or hopping) is employed in the simulations. C, statistical analysis of sFCS data showing that TF-PE can be fit with one component, whereas TF-SM and TF-Chol have two diffusional components; C1:slow component and C2:fast component. Mean ± S.D. of at least 10 independent simulations per condition is shown in B. In C, each data point shows a repetition of the sFCS measurement and each point consists of averaged data of >10 cells and >1000 curves. Black lines show the mean of the three repetitions.
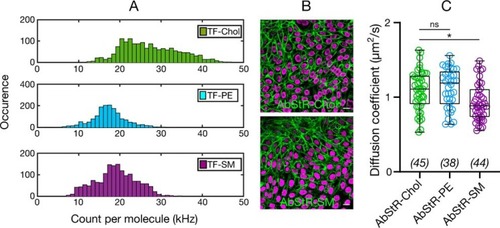
A, count per molecule (cpm) histograms determined from sFCS data for TF-Chol, TF-PE, and TF-SM in CHO cells showing higher cpm values for TF-Chol (>1000 curves). B, confocal images of CHO cells labeled with nonflipping Abberior Star Red-PEG-Chol and Abberior Star Red-SM. Scale bars are 10 μm. C, diffusion coefficient of Abberior Star Red-PEG-Chol, Abberior Star Red-PEG-PE, and Abberior Star Red-SM in CHO cells. Data are shown as box-and-whisker plot showing median, first and third quartiles, and all the data values. Number of data points are indicated on the graphs.
Acknowledgments
This image is the copyrighted work of the attributed author or publisher, and
ZFIN has permission only to display this image to its users.
Additional permissions should be obtained from the applicable author or publisher of the image.
Full text @ J. Biol. Chem.
Your Input Welcome
Thank you for submitting comments. Your input has been emailed to ZFIN curators who may contact you if
additional information is required.
Oops. Something went wrong. Please try again later.