|
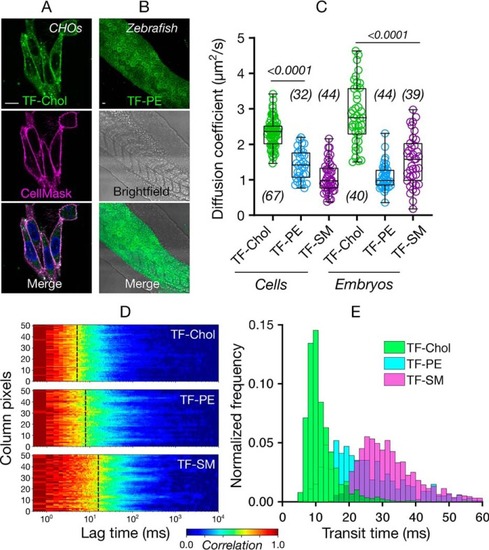
Diffusion of cholesterol compared with phospholipids in cellulo and in vivo. Confocal images of (A) CHO cells and (B) zebrafish embryos (24 h post fertilization) labeled with fluorescent lipid analogues (green) and Cell Mask Deep Red (magenta). Scale bars are 10 μm. C, diffusion coefficient of the fluorescent lipid analogues in CHO cells and zebrafish embryos. D, representative sFCS carpets for fluorescent lipid analogues in CHO cells. E, histogram of transit diffusion times of the fluorescent lipid analogues obtained from the sFCS data. Data are shown as box-and-whisker plot showing median, first and third quartiles, and maximum and minimum values. Number of data points are indicated on the graphs.
|