|
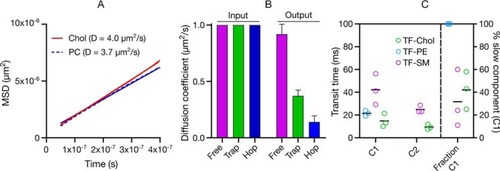
Diffusion mode of fluorescent lipid analogues.A, all-atom molecular dynamics simulation of cholesterol in liquid-disordered DPPC/DOPC/Chol membrane comparing cholesterol with phospholipid diffusion. B, Monte Carlo simulations of free, hop, and trapped diffusion probed by FCS showing how the hindrances affect the molecular diffusion. Input are the starting diffusion coefficients and Output are the diffusion coefficients when free diffusion or hindered diffusion (trapping or hopping) is employed in the simulations. C, statistical analysis of sFCS data showing that TF-PE can be fit with one component, whereas TF-SM and TF-Chol have two diffusional components; C1:slow component and C2:fast component. Mean ± S.D. of at least 10 independent simulations per condition is shown in B. In C, each data point shows a repetition of the sFCS measurement and each point consists of averaged data of >10 cells and >1000 curves. Black lines show the mean of the three repetitions.
|