FIGURE SUMMARY
Title

MutT homologue 1 (MTH1) removes N6-methyl-dATP from the dNTP pool

Authors
Scaletti, E.R., Vallin, K.S., Bräutigam, L., Sarno, A., Berglund, U.W., Helleday, T., Stenmark, P., Jemth, A.S.
Source
Full text @ J. Biol. Chem.

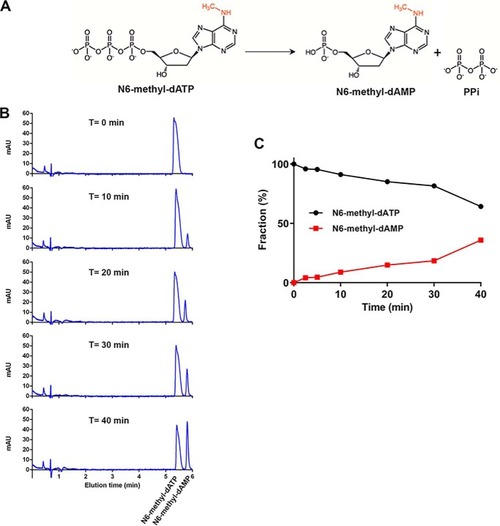
MTH1 catalyzes the hydrolysis of N6-methyl-dATP.A, MTH1 catalyzes the hydrolysis of N6-methyl-dATP to N6-methyl-dAMP and PPi. B, time course hydrolysis of N6-methyl-dATP (1 mm) catalyzed by MTH1 (20 nm) was monitored by separation of reaction samples incubated 0–40 min at 22 °C on a Hypercarb column using HPLC coupled to MS. Reaction substrate and product was detected at 254 nm and the mass of the product N6-methyl-dAMP was clearly observed by mass detection. C, graph showing the fraction of N6-methyl-dATP and N6-methyl-dAMP in percent after various times of hydrolysis based on the respective area under the curve of the peaks in the corresponding HPLC chromatogram.

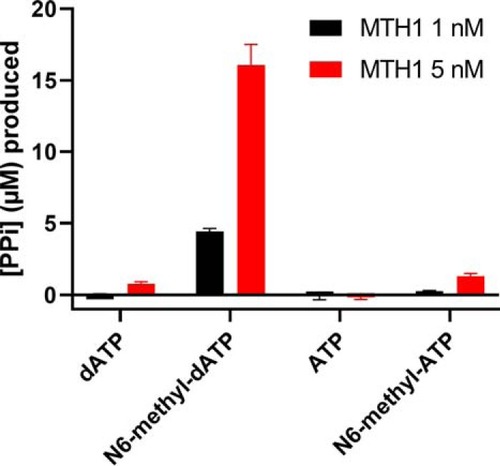
MTH1 activity with N6-methyl-dATP and N6-methyl-ATP compared with dATP. Activity of 1 and 5 nm MTH1 was tested with 50 μm N6-methyl-dATP, dATP, ATP, and N6-methyl-ATP in MTH1 reaction buffer (pH 8.0) at 22 °C. Reaction time was 30 min and 0.2 units/ml of PPase was used to generate Pi from produced PPi. Pi was detected by addition of malachite green reagent followed by measurement of the absorbance at 630 nm. Controls with PPase only was included and background signal was subtracted from the assay data. A Pi standard curve was included on the plate enabling determination of the concentration of formed PPi. Graph shows mean ± S.D. from one experiment performed in quadruplicate.

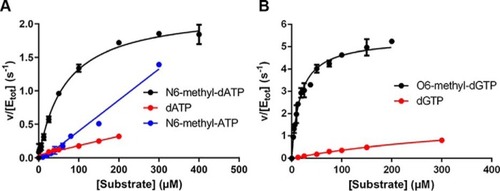
Kinetic characterization of MTH1-catalyzed hydrolysis of dATP, N6-methyl-dATP, N6-methyl-ATP, dGTP, and O6-methyl-dGTP.A, substrate saturation curves of MTH1 (1 nm) were produced using MTH1 reaction buffer (pH 7.5). Initial rates were determined at dATP concentrations varied between 0 and 200 μm and between 0 and 300 μm for N6-methyl-dATP and N6-methyl-ATP, respectively, and for dGTP and O6-methyl-dGTP (B) using 0–300 and 0–200 μm, respectively. Formed PPi was detected using PPiLightTM Inorganic Pyrophosphate Assay (Lonza) and the assay signal was converted to concentration of PPi by including a PPi standard curve on the assay plate.

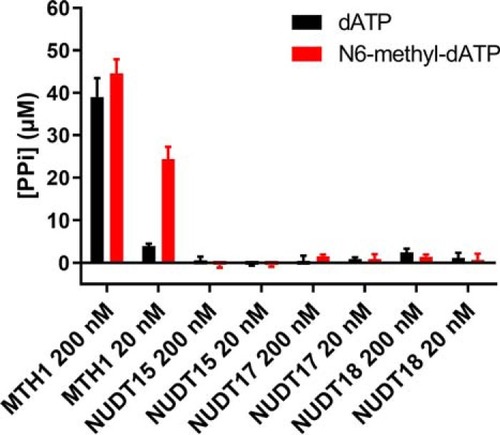
Activity with N6-methyl-dATP is unique to MTH1 within human NUDIX subfamily. Activities of human NUDIX enzyme (MTH1, NUDT15, NUDT17, and NUDT18) were assayed with data points in quadruplicate with 50 μm dATP or N6-methyl-dATP at 20 and 200 nm enzyme in MTH1 reaction buffer (pH 8.0). 0.2 units/ml of PPase was used to convert formed PPi to Pi that was detected using malachite green reagent and measurement of absorbance at 630 nm. Graph shows mean ± S.D. from one experiment performed in triplicate.

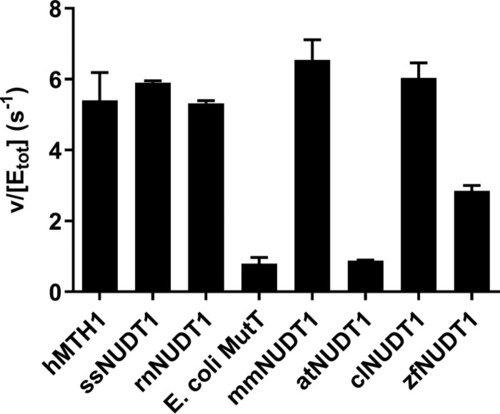
Activity with N6-methyl-dATP is evolutionary conserved among vertebrates. MutT homologues (MTH1 and NUDT1) from different animal species as well as E. coli MutT and NUDT1 from the plant A. thaliana were screened for hydrolysis activity with N6-methyl-dATP. Enzyme (1.25 nm) was incubated with 50 μm N6-methyl-dATP in MTH1 reaction buffer (pH 7.5) with 0.4 units/ml of PPase for 20 min at 22 °C in triplicates. Pi was detected using Biomol Green (Enzo Life Sciences). Absorbance at 630 nm was read after 20 min. A Pi standard curve was included on the plate and used to convert the assay signal to produced PPi. Data are shown as hydrolyzed N6-methyl-dATP (μm) divided by concentration of NUDT1 enzyme (μm) per second. The graph shows the mean ± S.D. from an experiment performed in triplicate.

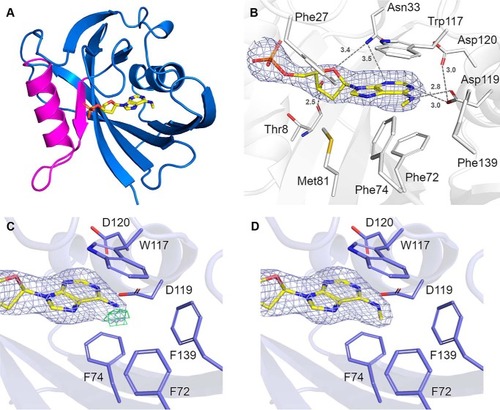
Crystal structure of hMTH1 in complex with N6-methyl-dAMP.A, overall structure of hMTH1 in ribbon representation, colored blue. The Nudix motif is colored magenta. N6-methyl-dAMP is presented as a stick model. B, the active site hydrogen bond network of hMTH1 with the reaction hydrolysis product N6-methyl-AMP (N6-met-AMP), with the 2FoFc composite omit map contoured at 1.0 σ. Important binding residues and residues of the hydrophobic pocket are depicted as sticks; C atoms are colored white, O atoms red, N atoms blue, and S atoms gold. N6-methyl-dAMP is presented as a stick model; C atoms are colored yellow, O atoms red, N atoms blue, and P atoms orange. Hydrogen bond interactions are shown as dashed lines with bond distances indicated in Angstroms (Å). C and D, refinement of hMTH1 structure. The ligands (C) dAMP and (D) N6-methyl-dAMP were modeled into hMTH1 in Coot (58) following which the structures were refined using Refmac5 (59). The 2FoFc electron density maps around the ligands following refinement are contoured at 1.0 σ (blue) and the FcFc electron density maps are contoured at −2.5 σ (red) and +2.5 σ (green). Figures were produced with PyMOL (version 2.1.1, Schrödinger). Single letter amino acids are used in the figure.

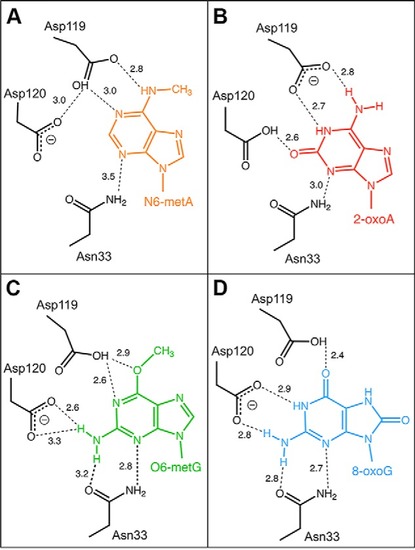
Schematic representation of the recognition of nucleotides by hMTH1. Hydrogen bond interactions of (A) N6-methyl-dAMP (N6-metA), (B) 2-oxo-dATP (2-oxoA) (23), (C) O6-methyl-dGMP (O6-metG) (10), and (D) 8-oxo-dGMP (8-oxoG) (24). Hydrogen bonds are shown as dashed lines and bond distances are given in Angstroms (Å). Deprotonated aspartates, which act as hydrogen bond acceptors, are indicated by the minus sign, where this is unambiguous.

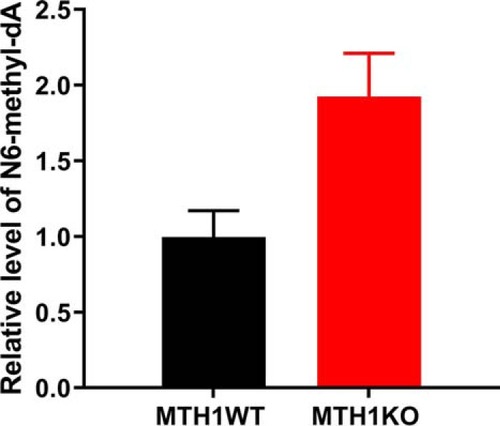
N6-methyl-dATP is incorporated into DNA in an MTH1-dependent manner. DNA was extracted from zebrafish MTH1KO and MTH1WT embryos developed from fertilized zebrafish eggs microinjected with N6-methyl-dATP or left untreated. DNA was analyzed for N6-methyl-dA content using LC-MS/MS. N6-methyl-dA content was normalized to N6-methyldA levels in untreated MTH1KO and MTH1WT zebrafish embryos, respectively. N6-methyl-dATP microinjected MTH1KO zebrafish embryos display a 2-fold higher N6-methyl-dA level compared with untreated embryos, whereas N6-methyl-dA DNA levels in MTH1WT zebrafish did not differ between untreated and N6-methyl-dA–microinjected embryos. This suggests that N6-methyl-dATP is incorporated into DNA and incorporation can be prevented by MTH1. The graph shows mean ± S.D., n = 2.

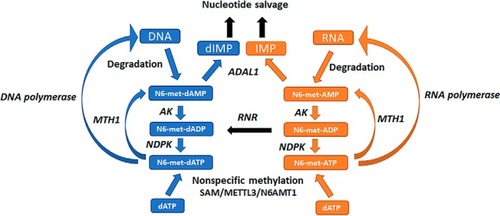
Potential routes for cellular production and metabolism of N6-methyl-dATP and N6-methyl-ATP. N6-methyl-dATP and N6-methyl-ATP may be produced from N6-methyl-dAMP and N6-methyl-AMP formed upon DNA and RNA degradation, respectively. This may occur through the consecutive actions of adenylate kinase (AK) and nucleoside diphosphate kinase or through nonspecific methylation by S-adenosylmethionine (SAM), the N6-adenosine-methyltransferase METTL3 or N6-adenine–specific DNA methyltransferase 1 (N6AMT1). N6-methyl-dATP and N6-methyl-ATP are hydrolyzed by MTH1 to their corresponding monophosphates and further metabolized by ADAL1 to dIMP and IMP that can then enter the nucleotide salvage pathway. Abbreviations used in the figure: NDPK, nucleoside diphosphate kinase; RNR, ribonucleotide reductase; METTL3, N6-adenosine methyltransferase; N6AMT1, N6-adenine-specific DNA methyltransferase 1.

Acknowledgments
This image is the copyrighted work of the attributed author or publisher, and ZFIN has permission only to display this image to its users. Additional permissions should be obtained from the applicable author or publisher of the image. Full text @ J. Biol. Chem.