
- Title
-
Optogenetic modulation of TDP-43 oligomerization accelerates ALS-related pathologies in the spinal motor neurons
- Authors
- Asakawa, K., Handa, H., Kawakami, K.
- Source
- Full text @ Nat. Commun.
PHENOTYPE:
Construct:
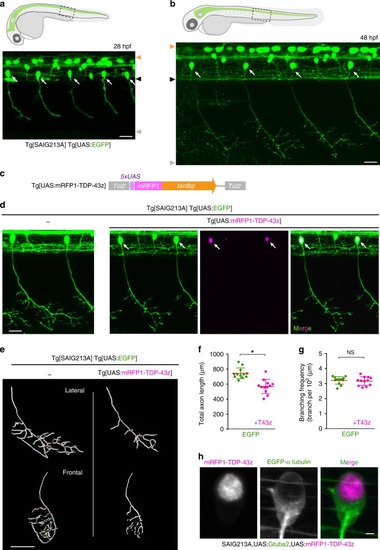
Tg(5xUAS:mRFP1-tardbpb)
|
|
|
PHENOTYPE:
|
|
|
EXPRESSION / LABELING:
|
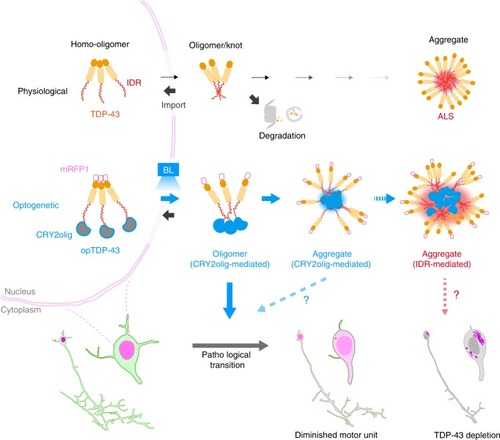
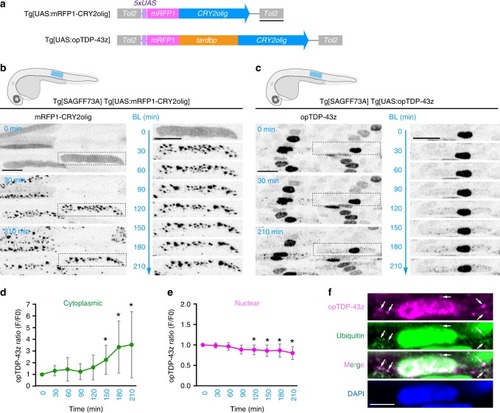
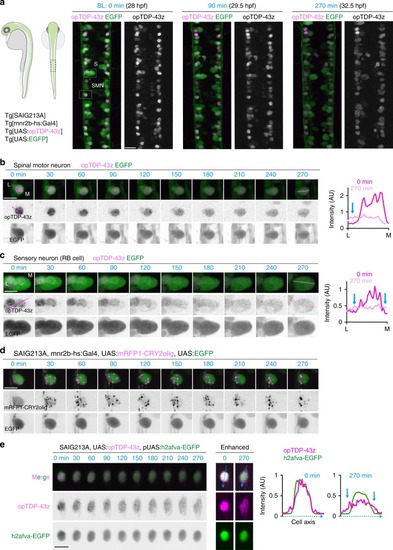
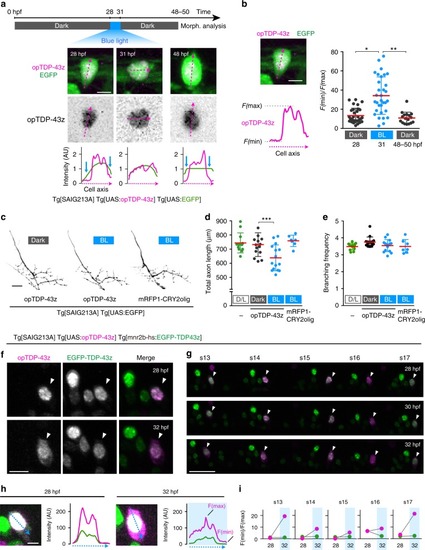
In physiological conditions, TDP-43 forms oligomers via its N-terminus and is primarily localized in the nucleus. Spinal motor neurons keep the cytoplasmic concentration of TDP-43 oligomers at a low level to prevent them from turning into toxic irreversible oligomers mediated by the C-terminus IDRs (toxic “knots”), which possess competence for developing into pathological TDP-43 aggregates, a hallmark of ALS. CRY2olig-driven opTDP-43 oligomerization promotes pathological change of the motor neurons, such as axon retraction associated with myofiber denervation, prior to accumulation of distinct cytoplasmic aggregates. Whether CRY2olig-diriven opTDP-43 aggregates are toxic to motor neurons and whether CRY2olig-diriven aggregates eventually deplete endogenous nuclear TDP-43 pools are unknown. |
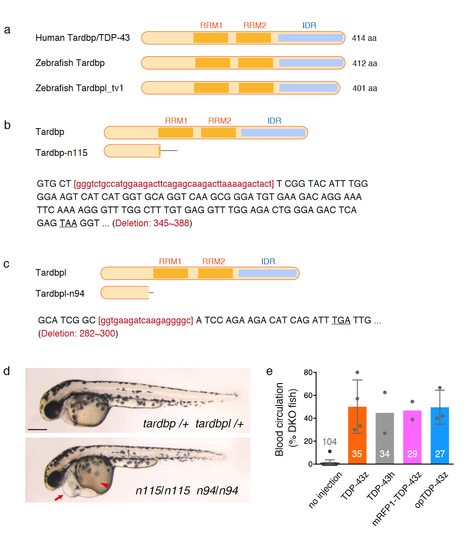
The structure of human and zebrafish Tardbp/TDP-43 proteins. RRM, RNA-recognition motif. IDR, intrinsically disordered region. (b, c) The tardbp-n115 and tardbpl-n94 mutations are frame-shift deletions that cause protein truncation. The deleted nucleotides were indicated by red lower cases. The grey bars indicate ectopically added peptide due to the frame shift. (d) The lateral views of the wild type (top) and double homozygous (bottom) larvae at 48 hpf. The arrow and arrowhead indicate the swollen heart and the stacked red blood cells on the far side of the yolk, respectively. The bar indicates 250 μm. (e) Rescue rate of the blood circulation defect of the tardbp-n115 tardbpl-n94 homozygotes (DKOs). The numbers on the histograms show the total numbers of DKOs investigated (Source data are provided as a Source Data file). Error bars show SD. |