IMAGE

Fig. 2

ID
ZDB-IMAGE-200306-105
Genes
Source
Figures for Asakawa et al., 2020
Image
Figure Caption

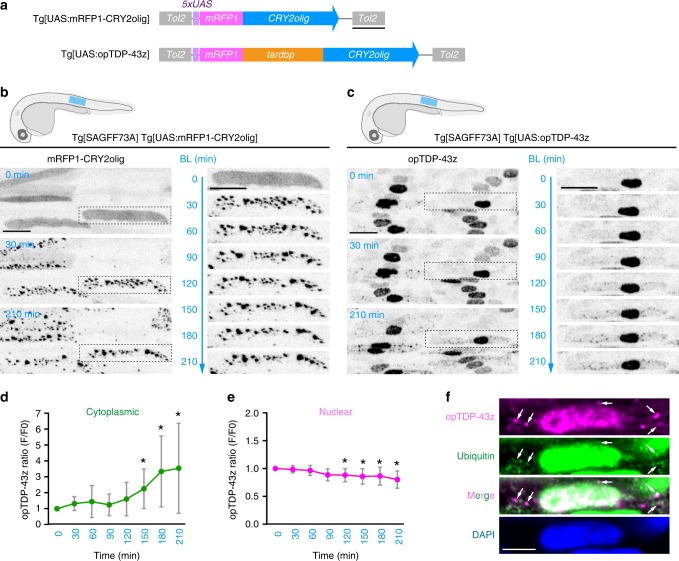
Fig. 2 A photo-switchable TDP-43: opTDP-43.

a The structures of Tg[UAS:mRFP1-CRY2olig] and Tg[UAS:opTDP-43z]. b, c Skeletal muscle of Tg[SAGFF73A] Tg[UAS:mRFP1-CRY2olig] and Tg[SAGFF73A] Tg[UAS:opTDP-43] fish from 28 hpf (0 min) to 31.5 hpf (210 hpf). The blue light was illuminated from 0 to 210 min. Montages of single skeletal muscle cells expressing mRFP1-CRY2olig and opTDP-43z (dashed boxes) are shown on the right. d, e The averaged change of opTDP-43z intensity in the cytoplasm (d) and nucleus (e) of skeletal muscle cells in Tg[SAGFF73A] Tg[UAS:opTDP-43z] fish during the illumination (N = 8 cells from the same animal). Error bars show SD, and the center of the error bars is the mean. The asterisks indicate the statistically significant change in opTDP-43z fluorescence intensity at each time point in comparison to the opTDP-43z level at t = 0, and adjustments were not made for multiple comparisons. In dp = 0.0125, 0.010, 0.0234 at 150, 180, 210 min, respectively (unpaired t-test, two-tailed). In ep = 0.0092, 0.0128, 0.0114, 0.0311 at 120, 150, 180, 210 min, respectively. f Immunofluorescence of the skeletal muscle of fish illuminated for 3.5 h, using anti-RFP (for opTDP-43z) and anti-ubiquitin antibodies. Arrows indicate the representative of opTDP-43z foci that are partially ubiquitinated. The bars indicate 500 bp (a), 20 µm (b, c), and 5 µm (f).

Figure Data
Acknowledgments
This image is the copyrighted work of the attributed author or publisher, and ZFIN has permission only to display this image to its users. Additional permissions should be obtained from the applicable author or publisher of the image. Full text @ Nat. Commun.