|
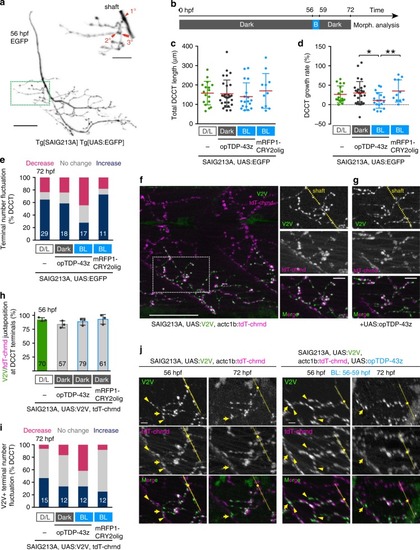
Axonal shrinkage and myofiber denervation caused by opTDP-43z.a A CaP motor axon of Tg[SAIG213A] Tg[UAS:EGFP] fish. DCCT (green box) was magnified on the right. Primary, secondary and tertial branchings were indicated in red. b Light-illumination paradigm. c–e Total length (c), growth rate (d) and fluctuation of axon terminal number (e) of DCCTs. Results were obtained from 5 independent animals in opTDP-43z/Dark condition and otherwise from 3 animals. The numbers in the histograms are total numbers of the cells examined. *p = 0.0224, **p = 0.0128 (unpaired t-test, two-tailed). f The lateral view of the trunk of Tg[SAIG213A] Tg[UAS:V2V] Tg[actc1b:tdT-chrnd] fish (left) and neuromuscular synapses of the DCCT (right) at 56 hpf. The dashed yellow lines indicate the CaP axon shaft. g Neuromuscular synapses of a DCCT in Tg[SAIG213A] Tg[UAS:opTDP-43z] Tg[UAS:V2V] Tg[actc1b:tdT-chrnd] fish at 56 hpf. h, i Occurrence of Vamp2-Venus/ tdT-chrnd juxtaposition prior to illumination at 56 hpf (h) and fluctuation of terminal number with Vamp2-Venus/tdT-chrnd juxtaposition at 72 hpf (i). The numbers in the histograms show the total numbers of axon terminals (h) and DCCTs (i) that were examined. Results were obtained from 4 independent animals in D/L condition and otherwise from 3 animals. j Live imaging of DCCT neuromuscular synapses. Yellow arrowheads indicate the neuromuscular synapses that were not present at 72 hpf. The yellow dashed lines, dots, arrows indicate axon shafts, primary branching points, and contact sites with the myotomal boundaries of CaPs, respectively. Z-stacks are produced from 3D-rotated images made by Imaris, to make the denervation events (arrowhead) clearly visible (j, right). The bars indicate 10 µm (a top, f right, g), 25 µm (a bottom, f left), 5 µm (j). Error bars show SD.
|