IMAGE

Fig. 6

ID
ZDB-IMAGE-200306-109
Genes
Source
Figures for Asakawa et al., 2020
Image
Figure Caption

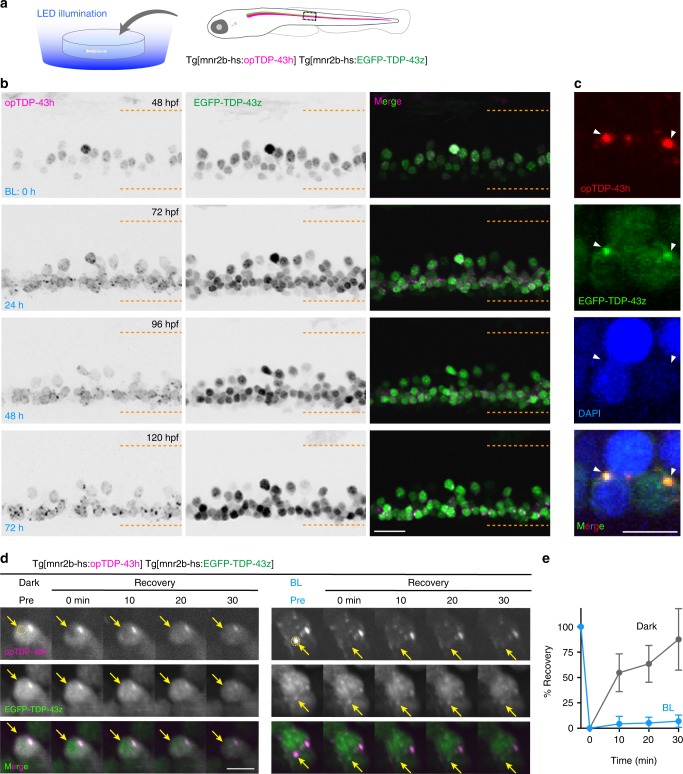
Fig. 6 Long-term illumination induces opTDP-43h aggregation that seeds non-optogenetic TDP-43 aggregation.

a Chronic field illumination of unrestrained Tg[mnr2b-hs:EGFP-TDP43z] Tg[mnr2b-hs:opTDP-43h] fish by blue LED light. b Live imaging of the spinal motor column from 48 to 120 hpf. Horizontal dashed lines demarcate approximate positions of dorsal and ventral limits of the spinal cord. c Cytoplasmic opTDP-43h foci colocalize with EGFP-TDP-43z. d FRAP analyses of nuclear opTDP43h that had not been exposed to blue light (left, Dark Pre) and cytoplasmic opTDP43h foci that had been induced by a 72-h blue light illumination (right, BL Pre). Bleaching was performed at 120 hpf. Yellow dashed circles (Pre) include photobleached area and arrows indicate the bleached position. e Quantification of fluorescent recovery. The results were obtained from 6 cells in independent 6 animals for each condition. Error bars show SD, and the center of the error bars is the average value. The bars indicate 20 µm (b), 5 µm (c, d). Error bars show SD.

Figure Data
Acknowledgments
This image is the copyrighted work of the attributed author or publisher, and ZFIN has permission only to display this image to its users. Additional permissions should be obtained from the applicable author or publisher of the image. Full text @ Nat. Commun.