FIGURE SUMMARY
Title

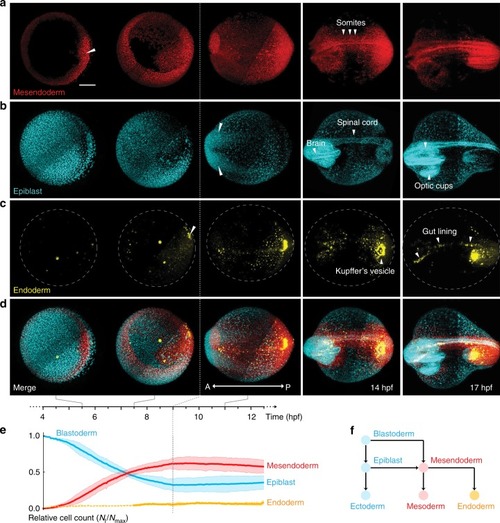
Multi-scale imaging and analysis identify pan-embryo cell dynamics of germlayer formation in zebrafish

Authors
Shah, G., Thierbach, K., Schmid, B., Waschke, J., Reade, A., Hlawitschka, M., Roeder, I., Scherf, N., Huisken, J.
Source
Full text @ Nat. Commun.

In toto imaging of germlayer specification and dynamics.

ac Formation and dynamics of mesendoderm (red), epiblast (cyan), and endoderm (yellow) cells spanning 4–17 hpf. n = 3 where all embryos resembled the images shown here. a Mesendoderm specification begins at the dorsal lip (white triangle), spreads around the germ ring and converges towards the dorsal midline, forming the somites and notochord (white triangles). b Epiblast cells converge towards the anterior (white triangles) leading to formation of brain, spinal cord and optic cups. c Endoderm specification begins at the dorsal shield (white triangle) with the DFCs, followed by rest of the endoderm, which forms the gut lining and Kupffer’s vesicle upon dorsal convergence. Yellow spots in the first two images is non-specific signal. d Merge of all three germlayers. Scale bar: 200 μm. A: anterior, P: posterior. e Mean relative cell numbers (n = 3) for epiblast (blue), mesendoderm (red) and endoderm (yellow). Bands correspond to 1.96 · standard error. Dashed part of the yellow line indicates the period before endoderm specification. f Schematic explaining germlayer specification showing blastoderm differentiating into mesendoderm and epiblast. Mesendoderm further differentiates into mesoderm and endoderm.

Position dependent organization of cell movement during early gastrulation.

ad Lateral views of the embryo at 4, 6.5, 9, and 11.5 hpf showing rendered object centroids located within a plane through the body axis (± 78 μm). Colors indicate the corresponding germlayer: epiblast (blue) mesendoderm (red) and endoderm (yellow). Colored arrows in (a) indicate epiboly of epiblast (blue) and internalization of mesendoderm (red), in b indicate epiboly movement of all three germlayers. AP: animal pole, VP: vegetal pole, D: dorsal, V: ventral. e Line plot showing mean radial position of all germlayers (normalized with respect to average radius of the mesendoderm) for a single embryo. Bands indicate mean + /− 0.3 standard deviation, the scaling was introduced to reduce overlap between germlayers and to visually highlight the thinning of layers. Dashed yellow line indicates the period before endoderm specification. f Cell trajectories for mesendodermal cells during early gastrulation (4.5–7 hpf; indicated by gray arrow in e) shown in lateral view. Color code indicates the straightness indices (SI) of trajectories. g Cell trajectories for epiblast cells, same views and color code as in f. h Scatterplot of SI vs. radial position r (computed at the midpoint) for each trajectory (4.5–7 hpf) of mesendoderm (red), epiblast (blue) and the respective 90% prediction ellipsoids. i Scatterplot of SI vs. position Φ along the longitude (computed at the midpoint) for each trajectory (4.5–7 hpf) of mesendoderm (red), epiblast (blue) and the respective 90% prediction ellipsoids.

Cell movements during internalization.

a Lateral view of the embryo showing movement of a subset of cells around shield region (4.5–7 hpf; selected subset of tracks shown in inset from animal pole). Arrows indicate direction of epiboly and internalization movement towards the animal pole. Color code shows normalized level of mezzo expression along each track. b Scatterplot showing the average change in radius and latitude for each track during 4.5–7 hpf time interval. Gray region indicates cells moving towards animal pole. Color code shows normalized mezzo expression. c Lateral view of long-term cell flows around shield region. Same region-of-interest as in a. Color code indicates normalized mezzo expression along track. d Lateral view of three clustered cell tracks undergoing internalization and movement towards animal pole. Thick lines show the representative cluster centroid trajectories. Magnified view of region indicated by box outline in a. e Dorsal view of long-term cell flows, same color code and region as in a. f Lateral view of the same clustered tracks and cluster centroids as in d.

Distinct tissue flow patterns of germlayers during late gastrulation.

a Cell densities shown as grayscale (white-low to black-high) on spherical representation of embryo. Regions of high densities (>0.33 normalized density) are color-coded, showing the extent of epiblast (blue) and mesendoderm (red) at various time points. Data shown in lateral (top) and dorsal (bottom) views. Arrows indicate expected direction of epiboly movement (solid) and convergence movement (dashed). AP: animal pole, VP: vegetal pole, MP: medio-posterior. b, c Proportions of epiboly (solid) and convergence (dashed) movement for epiblast (b) and mesendoderm (c) lines show mean across 3 embryos (n = 3). Gray dashed line indicates end of epiboly (tailbud stage). d General motion patterns of epiblast and mesendoderm shown as streamlines in Mercator projections, each interval covers ~1.5 h of development. Dorsal midline indicated by dashed line. Correlation of motion between germlayers is indicated as bars on the left edge of each streamline plot. e Tissue flow shown as density-weighted streamlines for epiblast and mesendoderm, thickness of streamlines indicates cell density at the respective site. Principal directions for epiboly (solid-gray) and convergence (dashed-gray) movement in Mercator projection are shown as overlay in f and g, respectively. g Border separating the ectodermal and mesendodermal flows is indicated by a solid line along the left-right axis.

Exploratory data analysis of long-term pan embryo cell dynamics.

a 3D rendering of long-term cell trajectories (A-anterior, P-posterior, dashed curve-dorsal midline). Color code shows normalized mezzo expression along each track. b 2D Mercator projection of cell tracks (A-anterior, P-posterior, dashed line-dorsal midline), same color code as in a. Principal directions for convergence (dashed-gray) movement and border separating the anterior and posterior flows (solid line along the left-right axis) are shown as overlays. c Space-time plots of long-term tracks over Mercator projection. Z-axis corresponds to time. Gray, dashed arrow illustrates the convergence movement (Conv). Dashed black line highlights movement of mesendodermal cells moving towards animal pole (AP). Solid black line indicates movement of mesendodermal cells undergoing epiboly (Epi). White line shows space-time line of a stationary object for reference. Inset shows subpopulation of cells with high normalized mezzo expression. Same color code as in a. d 3D rendering of bundled, long-term cell trajectories assembled from individual cell tracks (A-anterior, P-posterior, dashed curve-dorsal midline) highlighting structural details of cell migration patterns from 4 to 13 hpf. Color code shows normalized mezzo expression along track. Arrow indicates the internalized stream of mesendodermal cells towards animal pole. e 2D Mercator projection of bundled cell tracks reveals global structure of migration patterns across the developing embryo from 4 to 13 hpf (A-anterior, P-posterior, dashed line–dorsal midline). Border separating the anterior and posterior flows (solid line along the left-right axis) are shown as overlay. f Lateral view of selected anatomical region of interest. Long-term trajectories of cells within ROI are shown for 4–13 hpf time interval. Color code indicates normalized mezzo expression. Cell tracks outside of ROI shown as bundled tracks in gray. g Rotated, dorsal view of selected cell tracks shown in bundled state to highlight structure of cellular flows. hj Backtracking of cells in ROI in time intervals of 90 min. Same color code as f. Tracks outside of region of interest are shown as gray bundles. kn Lateral view of selected cell tracks, same visual coding as in gj.

Acknowledgments
This image is the copyrighted work of the attributed author or publisher, and ZFIN has permission only to display this image to its users. Additional permissions should be obtained from the applicable author or publisher of the image. Full text @ Nat. Commun.