IMAGE

Fig. 4

ID
ZDB-IMAGE-191230-1050
Source
Figures for Shah et al., 2019
Image
Figure Caption

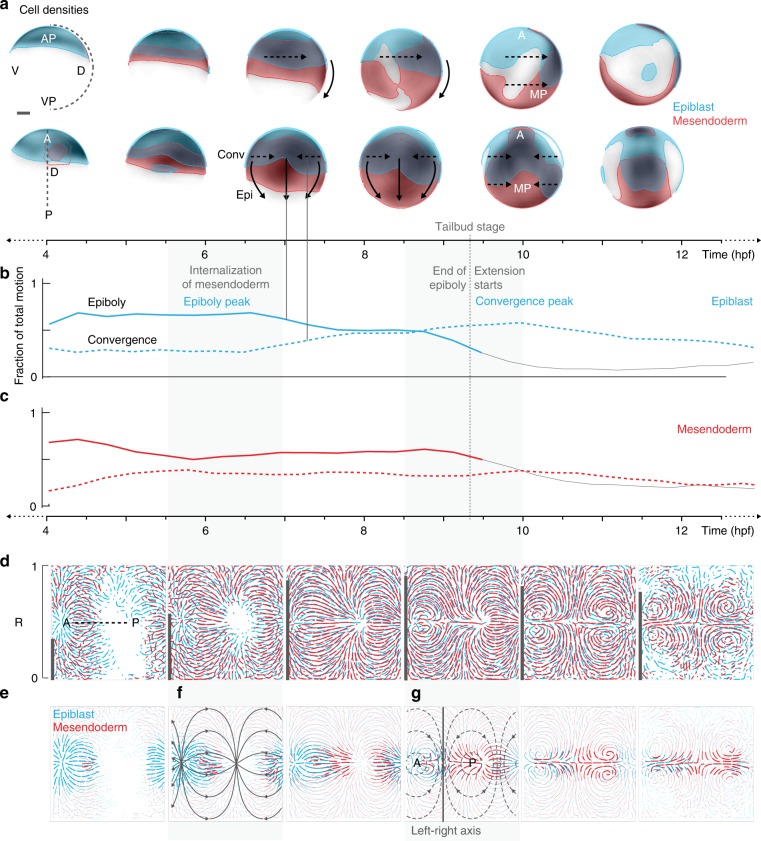
Fig. 4 Distinct tissue flow patterns of germlayers during late gastrulation.

a Cell densities shown as grayscale (white-low to black-high) on spherical representation of embryo. Regions of high densities (>0.33 normalized density) are color-coded, showing the extent of epiblast (blue) and mesendoderm (red) at various time points. Data shown in lateral (top) and dorsal (bottom) views. Arrows indicate expected direction of epiboly movement (solid) and convergence movement (dashed). AP: animal pole, VP: vegetal pole, MP: medio-posterior. b, c Proportions of epiboly (solid) and convergence (dashed) movement for epiblast (b) and mesendoderm (c) lines show mean across 3 embryos (n = 3). Gray dashed line indicates end of epiboly (tailbud stage). d General motion patterns of epiblast and mesendoderm shown as streamlines in Mercator projections, each interval covers ~1.5 h of development. Dorsal midline indicated by dashed line. Correlation of motion between germlayers is indicated as bars on the left edge of each streamline plot. e Tissue flow shown as density-weighted streamlines for epiblast and mesendoderm, thickness of streamlines indicates cell density at the respective site. Principal directions for epiboly (solid-gray) and convergence (dashed-gray) movement in Mercator projection are shown as overlay in f and g, respectively. g Border separating the ectodermal and mesendodermal flows is indicated by a solid line along the left-right axis.

Acknowledgments
This image is the copyrighted work of the attributed author or publisher, and ZFIN has permission only to display this image to its users. Additional permissions should be obtained from the applicable author or publisher of the image. Full text @ Nat. Commun.