|
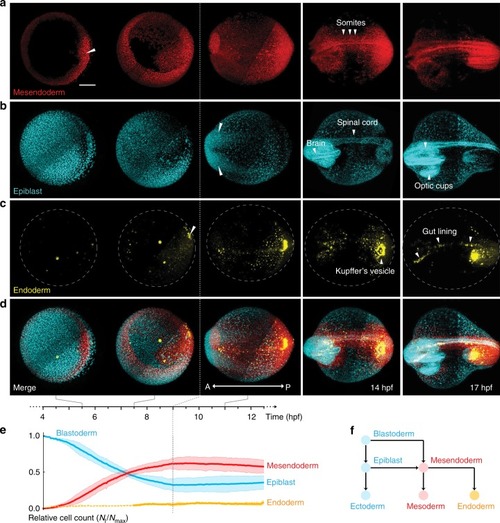
In toto imaging of germlayer specification and dynamics.a–c Formation and dynamics of mesendoderm (red), epiblast (cyan), and endoderm (yellow) cells spanning 4–17 hpf. n = 3 where all embryos resembled the images shown here. a Mesendoderm specification begins at the dorsal lip (white triangle), spreads around the germ ring and converges towards the dorsal midline, forming the somites and notochord (white triangles). b Epiblast cells converge towards the anterior (white triangles) leading to formation of brain, spinal cord and optic cups. c Endoderm specification begins at the dorsal shield (white triangle) with the DFCs, followed by rest of the endoderm, which forms the gut lining and Kupffer’s vesicle upon dorsal convergence. Yellow spots in the first two images is non-specific signal. d Merge of all three germlayers. Scale bar: 200 μm. A: anterior, P: posterior. e Mean relative cell numbers (n = 3) for epiblast (blue), mesendoderm (red) and endoderm (yellow). Bands correspond to 1.96 · standard error. Dashed part of the yellow line indicates the period before endoderm specification. f Schematic explaining germlayer specification showing blastoderm differentiating into mesendoderm and epiblast. Mesendoderm further differentiates into mesoderm and endoderm.
|