
- Title
-
Feeding Entrainment of the Zebrafish Circadian Clock Is Regulated by the Glucocorticoid Receptor
- Authors
- Morbiato, E., Frigato, E., Dinarello, A., Maradonna, F., Facchinello, N., Argenton, F., Carnevali, O., Dalla Valle, L., Bertolucci, C.
- Source
- Full text @ Cells
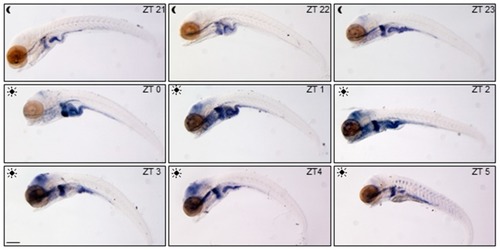
Spatial and temporal variations of glucocorticoid activity. WMISH of |
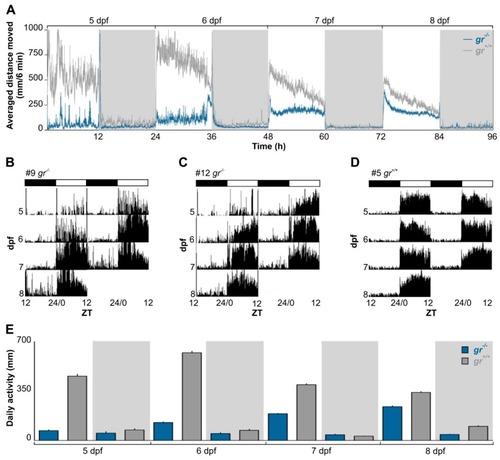
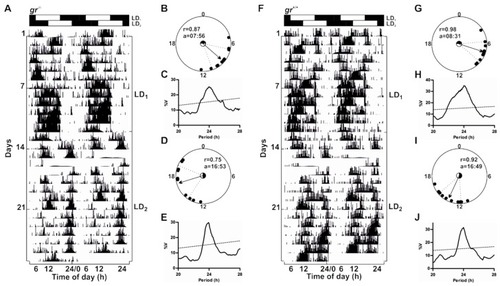
Daily activity rhythms of |
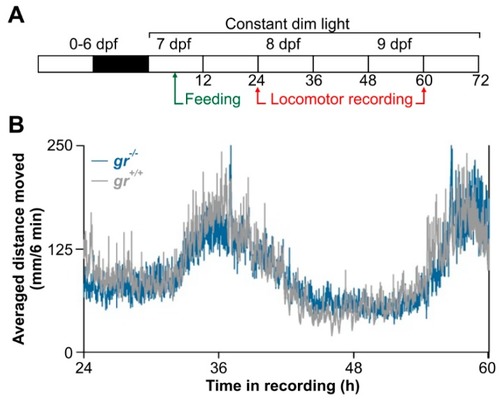
Circadian activity rhythms of |
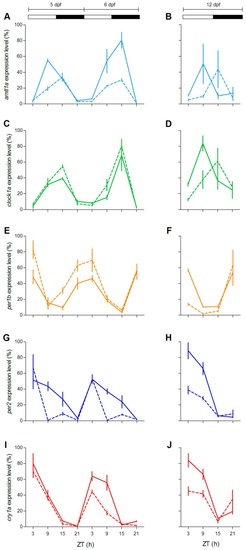
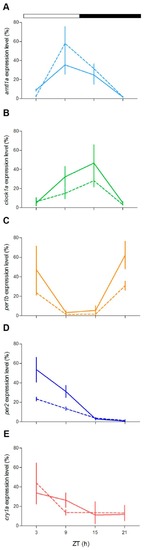
Daily expression levels of clock genes in zebrafish larvae. Quantitative polymerase chain reaction (qPCR) analysis of clock and light-regulated clock gene expression at 5–6 dpf ( |
Daily activity rhythms of |
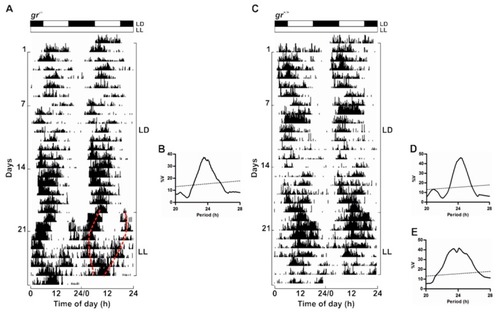
Circadian activity rhythms of |
Daily expression levels of clock genes in zebrafish adult eye. qPCR analysis of clock ( |
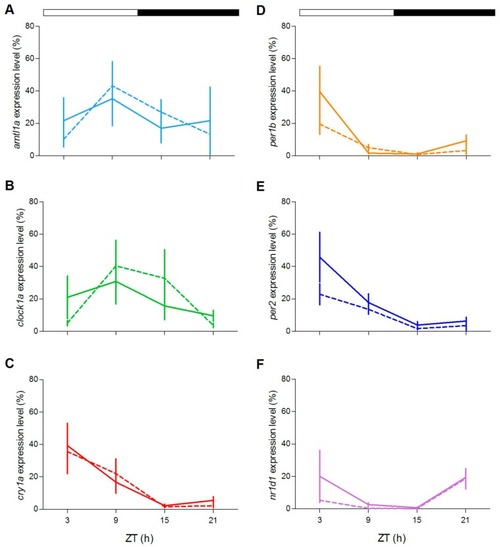
Daily expression levels of clock genes in zebrafish adult liver. qPCR analysis of clock ( |
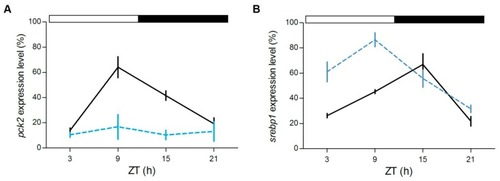
Daily expression levels of genes involved in metabolism in zebrafish adult liver. qPCR analysis of |
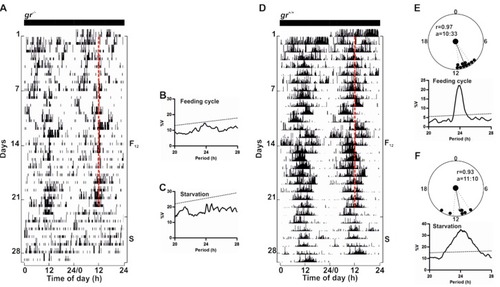
Behavioural entrainment by periodic food availability of |
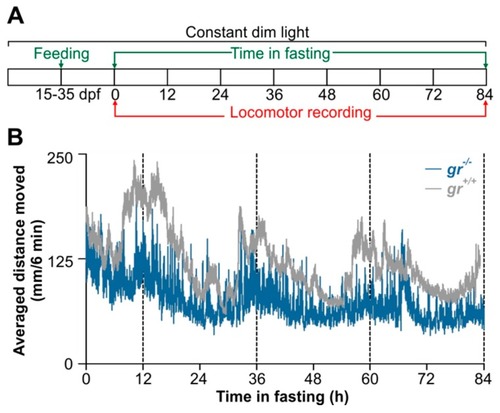
Behavioural entrainment by periodic food availability of |
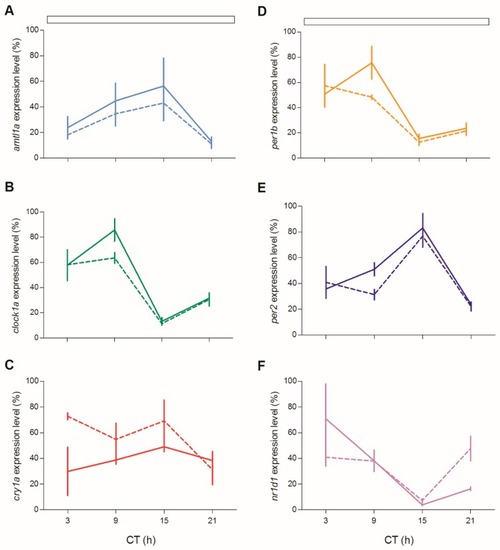
Circadian expression levels of clock genes in zebrafish juvenile. qPCR analysis of clock ( |