FIGURE

Figure 2

ID
ZDB-FIG-200104-23
Publication
Morbiato et al., 2019 - Feeding Entrainment of the Zebrafish Circadian Clock Is Regulated by the Glucocorticoid Receptor
Other Figures
All Figure Page
Back to All Figure Page
Figure 2

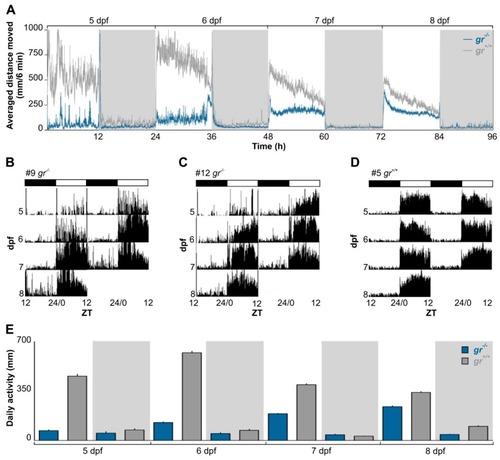
Daily activity rhythms of gr+/+ and gr−/− larvae zebrafish. (A) Mean waveform of locomotor activity under 12:12 LD cycles from 5 to 8 dpf (n=120/genotype). Vertical axis shows averaged distance moved (mm/6 min) while x axis indicates time in recording. White and grey bars show light and dark phase, respectively. Data are expressed as mean ± standard error of the mean (SEM). (BD) Representative actograms of 3 zebrafish (gr−/−: BC; gr+/+: D). Actograms are double plotted on a 48 h time scale to help the interpretation. The height of each point represents the distance travelled in 6 min. Bars at the top of each actogram indicate light (white) and dark (black) phases the LD cycles. The age of zebrafish is indicated on the left and the zeitgeber time (ZT) is plotted on the bottom of each actogram. (E) Mean activity (n = 120/genotype) in the light and dark phases from 5 to 8 dpf. Data are expressed as mean ± SEM.

Expression Data

Expression Detail
Antibody Labeling
Phenotype Data

Phenotype Detail
Acknowledgments
This image is the copyrighted work of the attributed author or publisher, and ZFIN has permission only to display this image to its users. Additional permissions should be obtained from the applicable author or publisher of the image. Full text @ Cells