
FIGURE
Figure 9
- ID
- ZDB-FIG-200104-30
- Publication
- Morbiato et al., 2019 - Feeding Entrainment of the Zebrafish Circadian Clock Is Regulated by the Glucocorticoid Receptor
- Other Figures
- All Figure Page
- Back to All Figure Page
Figure 9
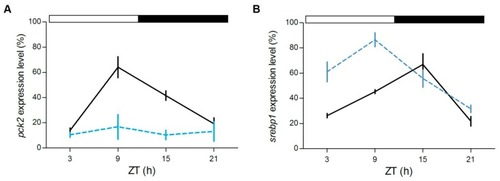
Daily expression levels of genes involved in metabolism in zebrafish adult liver. qPCR analysis of |
Expression Data
Expression Detail
Antibody Labeling
Phenotype Data
Phenotype Detail
Acknowledgments
This image is the copyrighted work of the attributed author or publisher, and
ZFIN has permission only to display this image to its users.
Additional permissions should be obtained from the applicable author or publisher of the image.
Full text @ Cells