
- Title
-
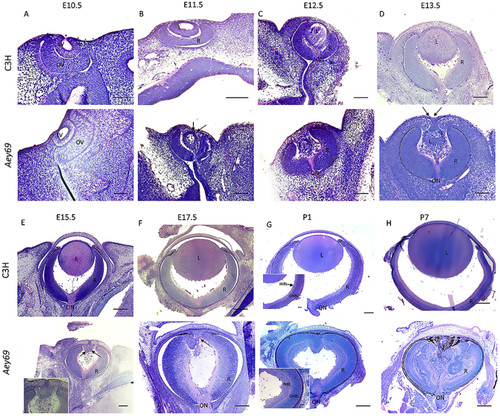
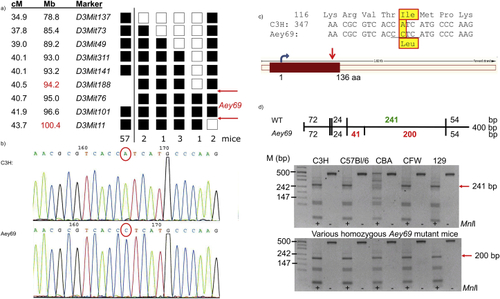
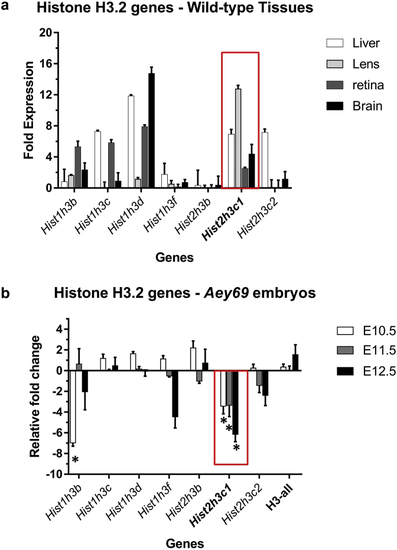
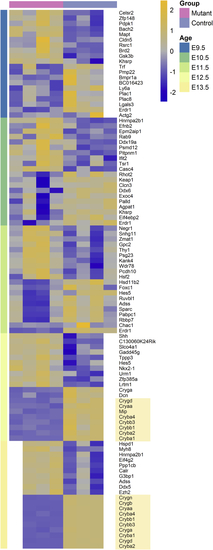
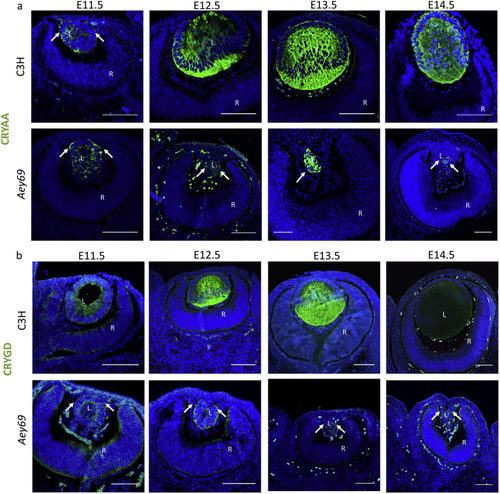
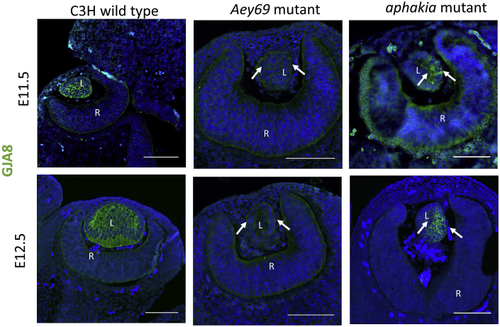
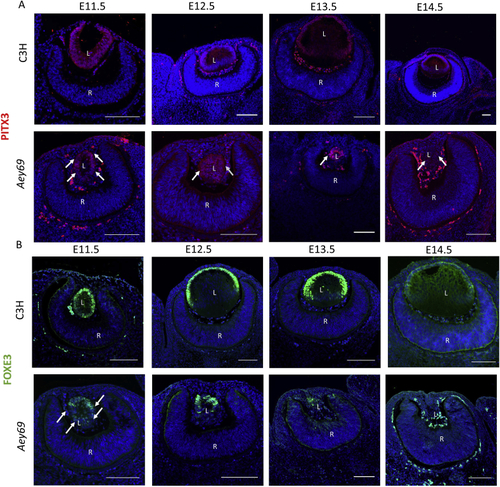
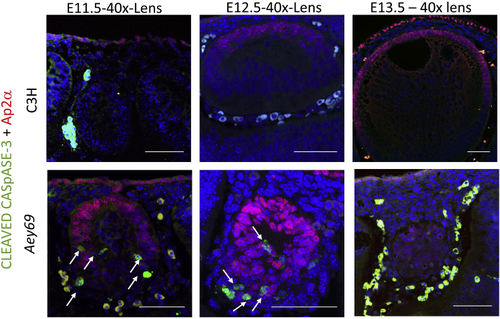
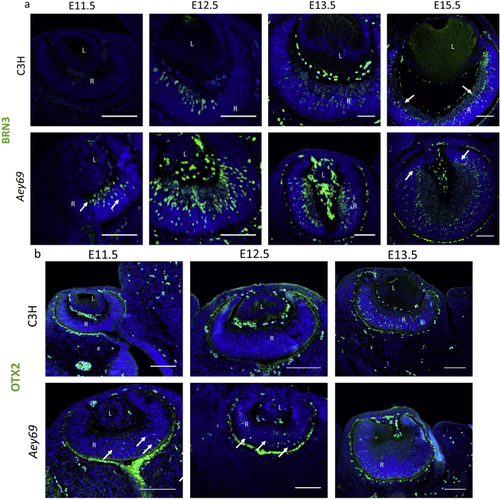
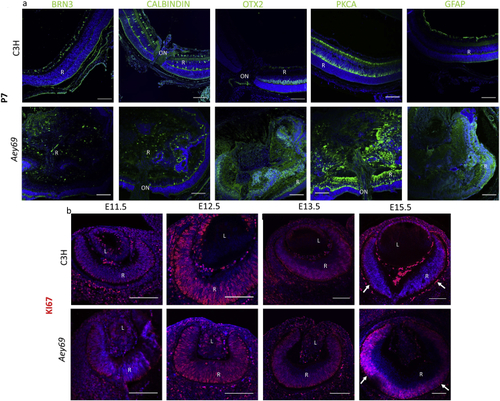
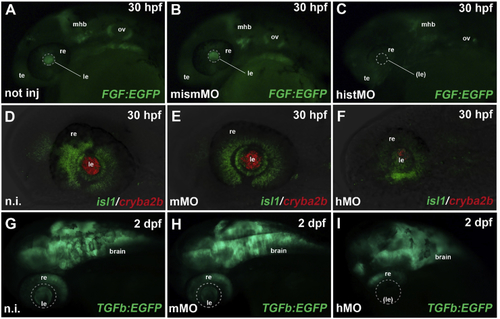
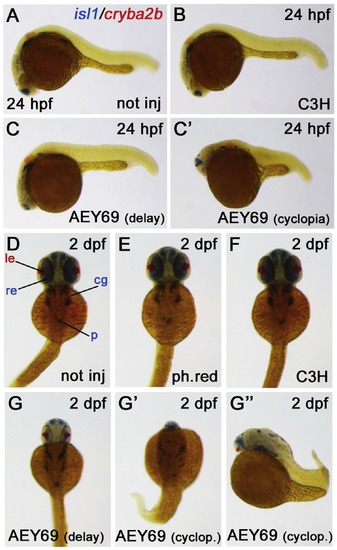
Mutation in the mouse histone gene Hist2h3c1 leads to degeneration of the lens vesicle and severe microphthalmia
- Authors
- Vetrivel, S., Tiso, N., Kügler, A., Irmler, M., Horsch, M., Beckers, J., Hladik, D., Giesert, F., Gailus-Durner, V., Fuchs, H., Sabrautzki, S., German Mouse Clinic, Helmholtz Zentrum München, German Research Center for Environmental Health GmbH, Neuherberg, Germany, Adler, T., Treise, I., Busch, D.H., Aguilar-Pimentel, A., Ollert, M., Götz, A., Amarie, O.V., Stoeger, T., Schulz, H., Becker, L., Klopstock, T., Schrewe, A., Spielmann, N., Bekeredjian, R., Garrett, L., Hölter, S.M., Zimprich, A., Wurst, W., Mayer-Kuckuk, P., Hans, W., Rozman, J., Klingenspor, M., Neff, F., da Silva-Buttkus, P., Calzada-Wack, J., Rácz, I., Zimmer, A., Rathkolb, B., Wolf, E., Prehn, C., Adamski, J., Östereicher, M., Miller, G., Steinkamp, R., Lengger, C., Maier, H., Stoeger, C., Leuchtenberger, S., Gailus-Durner, V., Fuchs, H., Hrabě de Angelis, M., Hrabě de Angelis, M., Graw, J.
- Source
- Full text @ Exp. Eye. Res.
|
|
|
|
|
|
|
|
|
|
|
|

ZFIN is incorporating published figure images and captions as part of an ongoing project. Figures from some publications have not yet been curated, or are not available for display because of copyright restrictions. PHENOTYPE:
|
Reprinted from Experimental Eye Research, 188, Vetrivel, S., Tiso, N., Kügler, A., Irmler, M., Horsch, M., Beckers, J., Hladik, D., Giesert, F., Gailus-Durner, V., Fuchs, H., Sabrautzki, S., German Mouse Clinic, Helmholtz Zentrum München, German Research Center for Environmental Health GmbH, Neuherberg, Germany, Adler, T., Treise, I., Busch, D.H., Aguilar-Pimentel, A., Ollert, M., Götz, A., Amarie, O.V., Stoeger, T., Schulz, H., Becker, L., Klopstock, T., Schrewe, A., Spielmann, N., Bekeredjian, R., Garrett, L., Hölter, S.M., Zimprich, A., Wurst, W., Mayer-Kuckuk, P., Hans, W., Rozman, J., Klingenspor, M., Neff, F., da Silva-Buttkus, P., Calzada-Wack, J., Rácz, I., Zimmer, A., Rathkolb, B., Wolf, E., Prehn, C., Adamski, J., Östereicher, M., Miller, G., Steinkamp, R., Lengger, C., Maier, H., Stoeger, C., Leuchtenberger, S., Gailus-Durner, V., Fuchs, H., Hrabě de Angelis, M., Hrabě de Angelis, M., Graw, J., Mutation in the mouse histone gene Hist2h3c1 leads to degeneration of the lens vesicle and severe microphthalmia, 107632, Copyright (2019) with permission from Elsevier. Full text @ Exp. Eye. Res.