
- Title
-
Distinct roles for the cell adhesion molecule Contactin2 in the development and function of neural circuits in zebrafish
- Authors
- Gurung, S., Asante, E., Hummel, D., Williams, A., Feldman-Schultz, O., Halloran, M.C., Sittaramane, V., Chandrasekhar, A.
- Source
- Full text @ Mech. Dev.
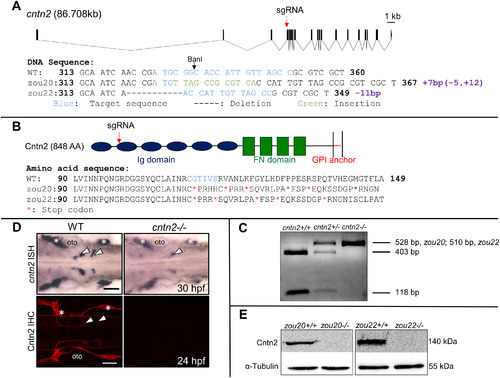
Generation and validation of CRISPR-generated cntn2 mutant. (A) Genomic structure of cntn2 containing 19 exons, with the CRISPR target site (sgRNA) in the 4th exon. The target site is highlighted in blue while the 7 bp insertion and the 11 bp deletion in cntn2zou20 and cntn2zou22 alleles are highlighted in green and indicated by dash marks, respectively. (B) Domain structure of Cntn2 containing six immunoglobulin (Ig) domains, four fibronectin (FN) domains, and a glycosylphosphatidylinositol (GPI)-anchor linked to the plasma membrane. Predicted amino acid sequences of wildtype (WT) cntn2, and cntn2zou20 and cntnzou22 alleles containing multiple stop codons (*). The highlighted AAs (blue) correspond to the CRISPR target site in the gene. (C) A PCR product (528 bp, zou20; 510 bp, zou22) spanning the target site digested with BanI differentiate between three genotypes: Wildtype (2 cut bands), heterozygote (1 uncut and 2 cut bands) and homozygote (1 uncut band). (D) Dorsal views of wildtype (WT) and mutant (zou20) hindbrains processed for cntn2 in situ hybridization (ISH) (upper panels) and anti-Cntn2 immunohistochemistry (IHC) (lower panels). Arrowheads indicate migrated FBM neurons and asterisks mark sensory ganglia. In cntn2 (zou20) mutants, cntn2 expression is greatly reduced, and Cntn2 protein is not detectable. Scale bar = 50 μm. (E) Western blot analysis of Cntn2 in cntn2zou20 and cntnzou22 embryos at 48 hpf. Cntn2 protein is not detectable in cntn2 mutants. Loading control is α-tubulin. (For interpretation of the references to colour in this figure legend, the reader is referred to the web version of this article.) |
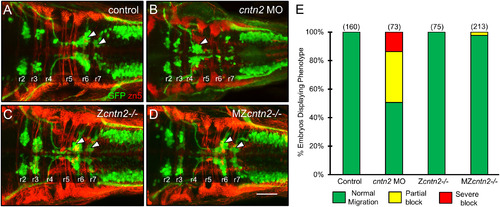
FBM neuron migration is affected in cntn2 morphants but not in cntn2 mutants Panels A-D show dorsal views of the hindbrain with anterior to the left. Tg(isl1:gfp) embryos were fixed at 48 hpf, and processed for immunohistochemistry with zn5 antibody (red) to label hindbrain commissural neurons and axons at rhombomere boundaries, and anti-GFP antibody (green) to label FBM neurons (arrowheads). (A) FBM neurons (arrowheads) migrate normally into r6 and r7 in an uninjected embryo. (B) FBM neurons largely fail to migrate out of r4 in a cntn2 MO-injected embryo. (C, D) FBM neurons migrate normally in zygotic mutant (Zcntn2−/−) (C), and maternal-zygotic mutant (MZcntn2−/−) (D) embryos. Scale bar in D, 50 μm for A–D. (E) Quantification of FBM neuron migration defects. Number in parenthesis denotes number of embryos. Data are from 3 to 4 experiments. (For interpretation of the references to colour in this figure legend, the reader is referred to the web version of this article.) |
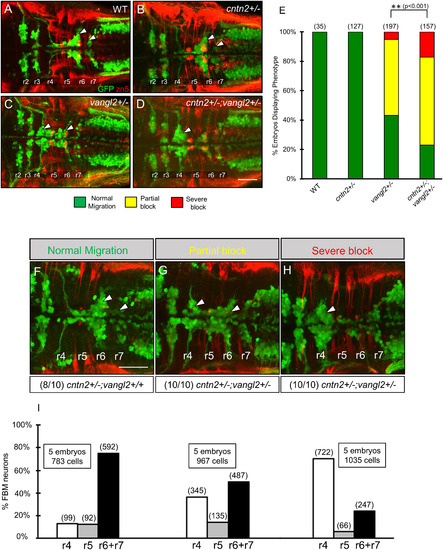
cntn2 interacts genetically with vangl2 but not with lamc1. Panels A–D and F–H show dorsal views of the hindbrain with anterior to the left. Tg(isl1:gfp) embryos were fixed at 48 hpf, and processed for immunohistochemistry with zn5 antibody (red) to label hindbrain commissural neurons and axons at rhombomere boundaries, and anti-GFP antibody (green) to label FBM neurons (arrowheads). (A) FBM neurons migrate normally in a control embryo. (B) FBM neurons migrate normally in a cntn2 heterozygous (cntn2+/−) embryo. (C) FBM neurons migrate poorly in a vangl2 heterozygous (vangl2+/−) embryo, with neurons located along the entire migratory pathway from r4 to r6. (D) FBM neurons fail to migrate out of r4 in a cntn2; vangl2 double heterozygote (cntn2+/−; vangl2+/−). Scale bar in D, 50 μm for A–D. (E) Quantification of genetic interaction data. Number in parenthesis denotes number of embryos. **Chi-square test at p < 0.001; NS: not significant. Data are from 2 to 4 experiments. (F–H) Offsprings of vangl2+/− heterozygous and cntn2−/− homozygous mutants exhibit normal, partial block, and severe block phenotypes for FBM neuron migration. Embryos exhibiting partial block (10/10) and severe block (10/10) were all identified as cntn2; vangl2 double heterozygote (cntn2+/−; vangl2+/−) and a majority of embryos (8/10) exhibiting normal migration were identified as cntn2+/−; vangl2+/+ by genotyping. (I) Quantification of non-migrated FBM neurons in r4, partially migrated FBM neurons in r5 and fully migrated FBM neurons in r6, and r7. Number in parenthesis denotes number of cells. Scale bar in F, 50 μm for F–H. |
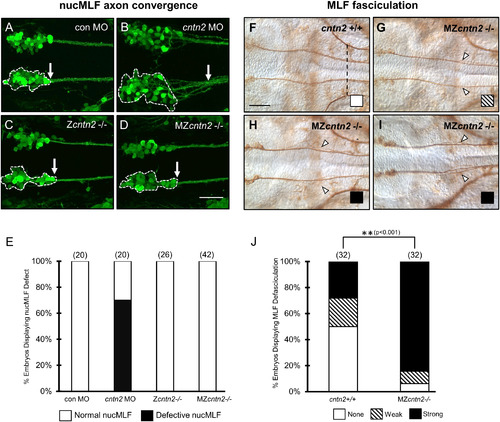
cntn2 mutants show MLF defasciculation but lacks nucMLF defects seen in morphants. Panels A-D show ventral views of the midbrain with anterior to the left. (A–D) Confocal projections of Tg(pitx2c:gfp) embryos labeled with anti-GFP antibody at 24 hpf. Panels F–I show ventral views of the midbrain and anterior hindbrain region with anterior to the left. (A) In a control MO-injected embryo, the nucMLF is found as bilateral groups of tightly clustered cells (delineated by dashed outline). Their axons form tight fascicles (arrow) immediately posterior to the neuron clusters. (B) In a cntn2 MO-injected embryo, the nucMLF neurons are loosely packed, and their axons are defasciculated. (C, D) The nucMLF neurons and axons converge normally in zygotic (Zcntn2−/−) and maternal-zygotic (MZcntn2−/−) mutants. (E) Quantification of nucMLF defects. Number in parenthesis denotes number of embryos. Data are from 2 to 4 experiments. (F |
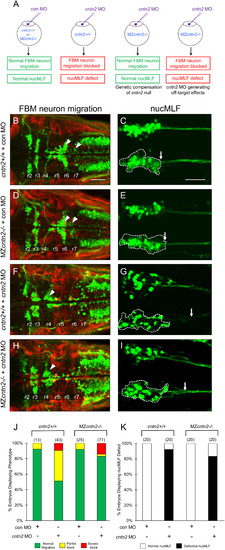
Some neuronal defects in cntn2 morphants are likely to be off-target effects. (A) Experiments to distinguish between genetic compensation in MZcntn2−/− mutants, and off-target effects of the cntn2 MO. Normal development of FBM and nucMLF neuron in MZcntn2−/− mutants injected with cntn2 MO would suggest compensation. However, defective development of both cell types in these embryos would suggest off-target effects. (B, D, F, H) Dorsal views of the hindbrain with anterior to the left. Tg(isl1:gfp) embryos were fixed at 48 hpf, and processed for immunohistochemistry with zn5 antibody (red) to label hindbrain commissural neurons and axons at rhombomere boundaries, and anti-GFP antibody (green) to label FBM neurons (arrowheads). (B, D) FBM neurons migrate normally in control MO-injected cntn2+/+ (B) and in MZcntn2−/− (D) embryos. (F, H) Migration of FBM neurons is greatly reduced in cntn2 MO-injected cntn2+/+ (F) and MZcntn2−/− (H) embryos. (C, E, G, I) Ventral views of the midbrain, with anterior to the left, of Tg(pitx2c:gfp) embryos labeled with anti-GFP antibody. (C, E) Normal nucMLF development in control MO-injected cntn2+/+ (C) and MZcntn2−/− (E) embryos. (G, I) Defective nucMLF development in cntn2 MO-injected cntn2+/+ (G) and MZcntn2−/− (I) embryos. (J) Quantification of data presented in B, D, F and H. Number in parenthesis denotes number of embryos. (K) Quantification of data presented in C, E, G and I. Number in parenthesis denotes number of embryos. Scale bar in B, 50 μm for B, D, F, and H; Scale bar in F, 50 μm for C, E, G, and I. (For interpretation of the references to colour in this figure legend, the reader is referred to the web version of this article.) |
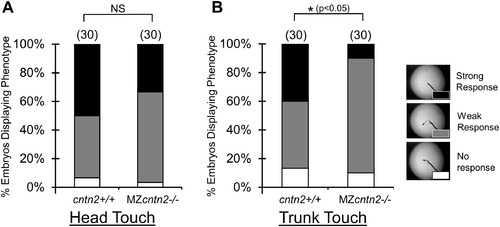
cntn2 mutants exhibit defective touch responses. PHENOTYPE:
|
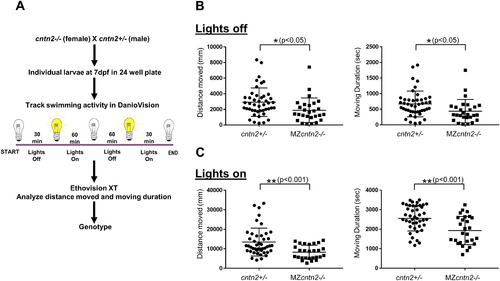
cntn2 mutants exhibit swimming deficits. PHENOTYPE:
|
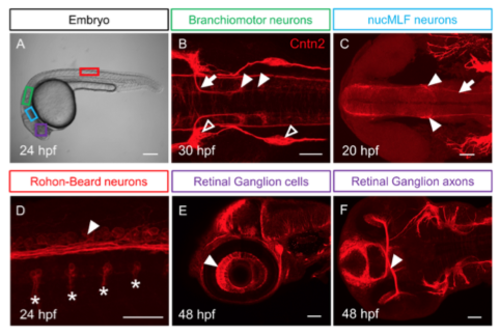
Cntn2 protein expression during embryonic development (A) Lateral view of a 24 hpf embryo with boxes indicating the location of different neuronal cell types in B-F. Panels B-F show confocal projections of embryos labeled with anti-Cntn2 antibody (red). Panel B shows a dorsal view, and C and F show ventral views. Panels D and E show lateral views. All panels show anterior to the left. (B) A 30 hpf embryo showing Cntn2 expression in FBM neuron cell bodies in r6 and r7 (arrowheads), and their axons (arrow). Open arrowheads mark sensory ganglia. (C) A 20 hpf embryo showing Cntn2 expression in nucMLF cell bodies (arrowheads), and their axons (arrow). (D) A 24 hpf embryo showing Cntn2 expression in central axons (arrowhead) of Rohon-Beard (RB) neurons. Asterisks indicate axons of primary motor neurons exiting the spinal cord. (E, F) A 48 hpf embryo showing Cntn2 expression in nasal RGC (arrowhead, E) as well as RGC axons (arrowhead, F). Scale bars: A, 200 μm, and B-F, 50 μm. |
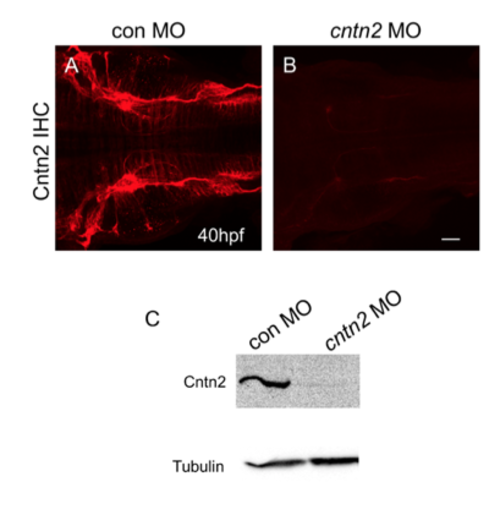
Knock down of Cntn2 expression with antisense MO Top panels show dorsal view of hindbrain, with anterior to the left, in embryos labeled with the anti-Cntn2 antibody. (A, B) Cntn2 is highly expressed in a control MO-injected embryo (A). Cntn2 expression is almost completely eliminated in a cntn2 MO-injected embryo (B). (C) Western blot analysis shows severe reduction of Cntn2 protein in cntn2 MO-injected embryos at 48 hpf. Scale bar in B, 50 μm for A and B. |
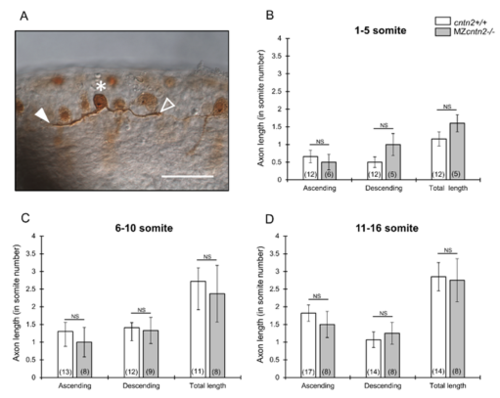
Outgrowth of Rohon-Beard central axons is not affected in MZcntn2 mutants (A) Embryos injected with ngn1:GFP-caax DNA and Tol2 transposase RNA were fixed at 18 hpf, and processed for immunohistochemistry with anti-GFP antibody to label Rohon-Beard (RB) neurons . Asterisk indicates cell body, and the filled and open arrowheads indicate ascending and descending central axons, respectively, of a labeled RB neuron. Scale bar, 50 μm. (B-D) Quantification of the lengths of ascending and descending central axons, and total length (sum of ascending and descending lengths) of central axons of RB neurons located in the anterior (somites 1-5), intermediate (somite 6-10) and posterior (somites 11-16) regions of the spinal cord. There were no significant differences in the length of RB central axons between wildtype and MZcntn2 mutant embryos. Number of RB neurons scored is shown in parenthesis. Unpaired t-test; NS: not significant. Error bars show Mean ± SEM. |
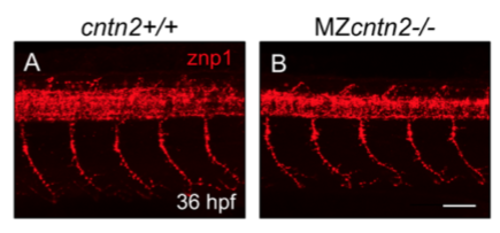
Spinal motor axons develop normally in cntn2 mutants Lateral views of the trunk with anterior to the left, in 36 hpf embryos stained with znp1 antibody. (A) In a wildtype embryo, the motor axon fascicles have extended into the ventral trunk musculature. (B) In a MZcntn2 mutant, the pattern of motor axon outgrowth is not affected. Scale bar in B, 50 μm for A and B. |
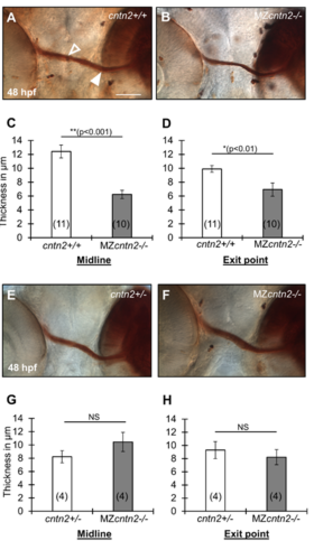
Retinal ganglion cell axon fascicles are variably affected in cntn2 mutants (A, B, E, F) Ventral view of DiI-labeled retinal ganglion cell (RGC) axon fascicles after photoconversion in cntn2+/+ (A), cntn2+/- (E) and MZcntn2-/- (B, F) embryos at 48 hpf. The DiI-injected region targeting the nasal RGCs appears as a dark brown area on the right side in each panel. The filled arrowhead marks an RGC axon fascicle at the exit point from the eye, and the open arrowhead marks an RGC axon fascicle at the midline. (C, D, G, H) Summary of RGC axon fascicles thickness in wild-type and MZcntn2-/- embryos. The RGC axon fascicles are significantly thinner at the midline (C) and at the exit point from the eye (D) in MZcntn2-/- mutants (B) compared to cntn2+/+ cousins (A). However, these differences were not seen (G, H) when MZcntn2-/- mutants (F) were compared to cntn2+/- siblings (E). Scale bar in A, 50 μm for A, B, E, and F. Unpaired t-test; NS: not significant. Error bars show Mean ± SEM. |
Reprinted from Mechanisms of Development, 152, Gurung, S., Asante, E., Hummel, D., Williams, A., Feldman-Schultz, O., Halloran, M.C., Sittaramane, V., Chandrasekhar, A., Distinct roles for the cell adhesion molecule Contactin2 in the development and function of neural circuits in zebrafish, 1-12, Copyright (2018) with permission from Elsevier. Full text @ Mech. Dev.