
- Title
-
Generation of a double binary transgenic zebrafish model to study myeloid gene regulation in response to oncogene activation in melanocytes
- Authors
- Kenyon, A., Gavriouchkina, D., Zorman, J., Chong-Morrison, V., Napolitani, G., Cerundolo, V., Sauka-Spengler, T.
- Source
- Full text @ Dis. Model. Mech.
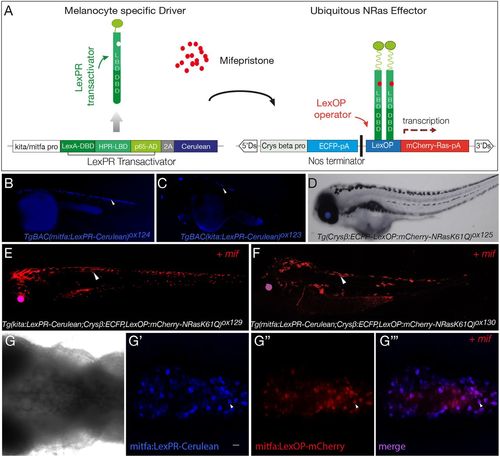
LexPR mifepristone-inducible model for melanocyte oncogenic activation. (A) Diagram of LexPR/LexOP inducible system. The LexPR driver cassette consists of LexPR transactivator and a Cerulean reporter under the control of melanocyte-specific promoters, kita or mitfa. The effector cassette contains the Lex operator sequence (LexOP) fused to the mCherry–Ras-oncogene. mCherry-Ras fusion is transcribed in trans only in the presence of mifepristone, when the LexPR transactivator-mifepristone complex binds to the LexOP sequence upstream of the oncogene expression cassette. (B,C) mitfa:LexPR-Cerulean [TgBAC(mitfa:LexPR-Cerulean)ox124] and kita:LexPR-Cerulean [TgBAC(kita:LexPR-Cerulean)ox123] transactivator driver lines were characterised by expression of LexPR transactivator and its cognate fluorescent protein Cerulean specifically in melanocytes. (D) LexOP:mCherry-NRas effector line [Tg(Crysβ:ECFP-LexOP:mCherry-NRasQ61K)ox125] shows ECFP expression in the eye, but no oncogene transcription. (E,F) The melanocyte-specific expression of mCherry-NRas in transgenic larvae harbouring both a transactivation driver and an oncogene effector allele [Tg(kita/mitfa:LexPR-Cerulean;LexOP:mCherry-NRasQ61K)ox129/ox130] is activated by addition of 1 μM mifepristone to the embryo rearing solution. (G-G‴). Confocal z-stack projection of the dorsal view of the melanocytes in the hindbrain region of a Tg(mitfa:LexPR-Cerulean;LexOP:mCherry-NRasQ61K)ox130 transgenic larvae shows brightfield view (G). LexPR-Cerulean fusion (blue) (G′) and mifepristone-dependent activation of LexOP:mCherry-NRasQ61K fusion (red) (G″) and the overlap (purple) (G‴). Larvae were partially bleached to attenuate the pigment and the mCherry signal was amplified with an anti-Cherry antibody. White arrowheads show Cerulean and mCherry signal localised to the melanocytes. Scale bar: 25 μm. EXPRESSION / LABELING:
|
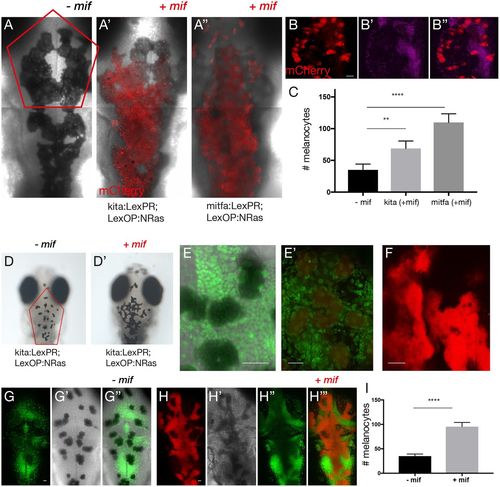
Morphology and proliferative capacity of oncogene-activated melanocytes. (A-A″) Composite images show confocal z-stack projection of the dorsal views of the head of 5-dpf larvae without (A) and with mifepristone-dependent mCherry-NRasQ61K activation (red) in Tg(kita:LexPR-Cerulean;LexOP:mCherry-NRas)ox12 (A′) and Tg(mitfa:LexPR-Cerulean;LexOP:mCherry-NRas)ox130 (A″). The melanocyte-specific expression of mCherry-NRas in transgenic larvae harbouring both a transactivation driver and oncogene effector alleles was activated by addition of 1 μM mifepristone to the embryo rearing solution starting at 24 hpf. (B-B″) Representative image of the procedure used to facilitate counting of melanocytes shows a confocal z-stack projection of melanocytes (red) with a single plane of nuclear stain (magenta). (C) Quantification of the number of melanocytes in the region indicated by the red outline in A, comparing larvae from experimental (+mif) kita:LexPR;LexOP:NRasQ61K (n=8) and mitfa:LexPR;LexOP:NRasQ61K (n=8) to controls (−mif, n=7). Graph shows means±s.e.m. Statistical significance was determined by two-tailed unpaired Student's t-test with Welch's correction. (D,D′) Dorsal views of the head of 12-dpf larvae without (D) and with (D′) mifepristone-dependent mCherry-NRasQ61K activation in Tg(kita:LexPR-Cerulean;LexOP:mCherry-NRas)ox12. (E,E′) Proliferative activity of activated melanocytes (red) (E′) shown with a nuclear stain (green) as compared to controls (E). (F) Confocal z-stack projection of melanocytes (red). (G,H) Representative image of the method used to facilitate counting of melanocytes shows a confocal z-stack projection of melanocytes (red) with a single plane of nuclear stain (green) in the absence (G) and presence (H) of mifepristone. (I) Quantification of the number of melanocytes in the region indicated by the red outline in D, comparing larvae from kita:LexPR;LexOP:NRasQ61K (n=8) with and without oncogene activation (+/−mif). Graph shows means±s.e.m. Statistical significance was determined by two-tailed unpaired Student's t-test with Welch's correction. **P<0.01; ****P<0.0001. Scale bars: (B) 25 μm; (E) 31 μm; (E′) 27 μm; (F) 28 μm; (G) 25 μm and (H) 25 μm. |
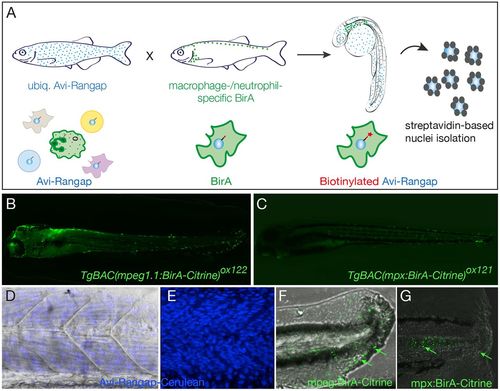
Binary transgenic zebrafish model for regulatory profiling of myeloid cells. (A) Schematic of myeloid nuclear biotagging system. When biotagging effector transgenic zebrafish line ubiquitously expressing Avi-tagged Rangap for biotinylation of nuclei is crossed to biotagging driver line expressing BirA in myeloid-specific manner, only the macrophage or neutrophil nuclei will be biotinylated. (B) Transgene expression in macrophage-specific BirA driver, TgBAC(mpeg1:BirA-Citrine)ox122, is amplified with anti-GFP–Alexa-Fluor-488 to show expression in macrophages. (C) TgBAC(mpx:BirA-Citrine)ox121 biotagging transgenic driver shows neutrophil-specific expression. (D,E) Projection of confocal microscope images of Tg(bactin:Avi-Cerulean-Rangap)ct700a shows ubiquitous expression of the biotag effector specifically on nuclei, across somite region of the embryo, with (D) and without (E) bright field background. The images in D and E are taken in different embryos. (F,G) Tailfins of transgenic fish transected at 3 dpf show responding macrophages in mpeg1:BirA-Citrine (F) and neutrophils in mpx:BirA-Citrine (G) larvae at 5 hpi or 1 hpi, respectively, as indicated by green arrows. EXPRESSION / LABELING:
|
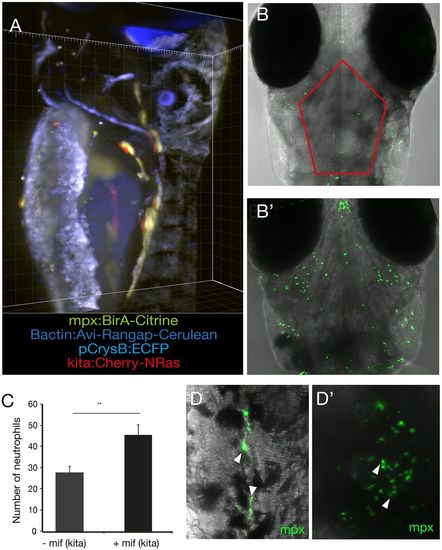
mCherry-NRasK61Q-activated melanocytes are immunogenic. (A) Larvae at 5 dpi harbouring all four alleles (blue eye, blue nuclei, green neutrophils and red melanocytes) as captured on a Zeiss Z1 Light Sheet microscope. kita:LexPR;LexOP:NRasQ61K were crossed to mpx:BirA;bactin:Avi-Rangap, and mCherry-NRas activated by addition of mifepristone. (B) The melanocyte-specific oncogene NRasK61Q was activated by addition of mifepristone to the E3 medium in Tg(kita:LexPR-Cerulean;pCrysβ:ECFP-LexOP:mCherry-NRasQ61K)ox129 embryos at 24 hpf. At 5 dpi, composite confocal images show neutrophils (green) as detected with an anti-mpx antibody in stage-matched controls (−mif) (B) and embryos where the oncogene had been activated (+mif) (B′). Images are a maximum intensity projection of 11 z-stack projections captured from the surface of the embryo to a depth of 100 μm. (C) Quantification of the number of neutrophils in the region of cranial melanocytes in the outlined area in B in control larvae (−mif, n=8) and following oncogene activation (+mif, n=8). Graph shows means±s.e.m. Statistical significance was determined by two-tailed unpaired Student's t-test with Welch's correction. **P<0.01. (D) High-resolution image of neutrophils in the tail (D) and head (D′) of 5-dpf zebrafish larvae following oncogene activation at 24 hpf, as shown by the arrowheads. |
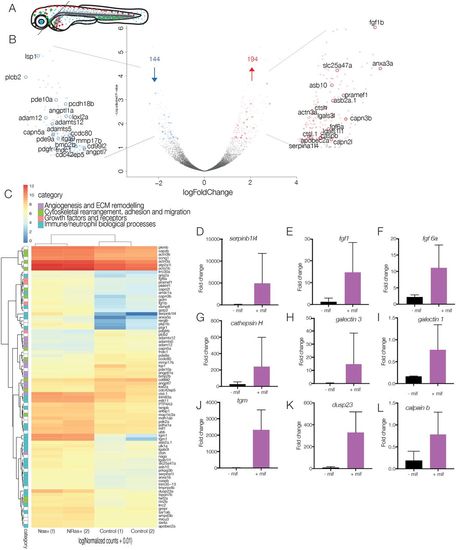
Analysis of technical replicates to obtain differentially expressed genes. (A) Schematic of dissection of 5-dpf larvae for nuclear profiling of neutrophils in the presence or absence of NRasQ61K-transformed cranial melanocytes. Cranial regions are dissected away from the trunk to eliminate neutrophils from the anterior yolk sac and ICM, enriching for responding neutrophils. (B) Volcano plot of differential expression analysis of activated NRasQ61K and control embryos shows the relationship between P-value and log fold change (red, upregulated; blue, downregulated) shows 194 upregulated genes (red) and 144 downregulated genes (blue) in cranial neutrophils. (C) Heat map shows the log10 [normalised counts (NMCT) +0.01] of selected differentially expressed transcripts (adjusted P-value <0.05). Red, high expression; yellow, medium expression; blue, low expression. Selected differentially expressed transcripts were further classified into subcategories of ‘angiogenesis and ECM remodelling’ (purple), ‘cytoskeletal rearrangement, adhesion and migration’ (green), ‘growth factors and receptors’ (pink) and ‘immune/neutrophil biological processes’ (turquoise). (D-L) Bar graphs represent mRNA levels of upregulated transcripts in controls vs NRasQ61K-activated embryos as measured by qPCR in 2-3 replicate experiments. serpinb1l4 (D), fgf1 (E), fgf6 (F), cathepsin H (G), galectin 3 (H), galectin 1 (I), tgm (J), dusp23 (K) and calpain b (L). |
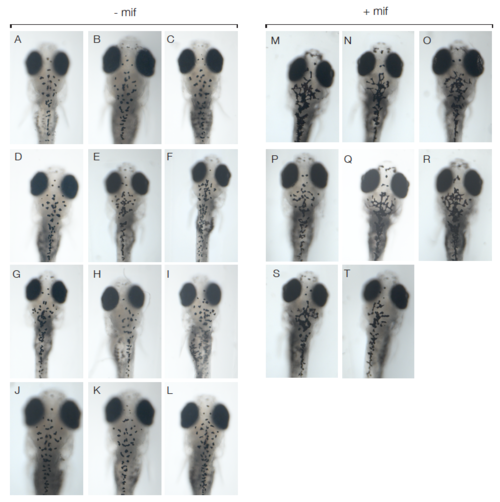
Comparison of melanocyte morphology in Tg(kita:LexPRCerulean; LexOP:mCherry-NRas)ox12 in oncogene activated (+mif) 12 dpf larvae versus controls (-mif). (A-T) Dorsal views of the head of 12 dpf larvae without (AL) and with mifepristone-dependent mCherry-NRasQ61K activation (red) in Tg(kita:LexPR-Cerulean;LexOP:mCherry-NRas)ox12 (M-T). |